Every figure on this page links to the organization that produced it, and each was re-checked against that source before publishing. How big the U.S. beauty industry is in government counts, what beauty companies' own filings say they spend on advertising, digital media and creators, what the platforms report about beauty video, how much beauty sells through TikTok Shop, how shoppers use social video, the rules on beauty influencer ads, and which popular beauty video statistics don't hold up.
Americans spent $75,854 million on cosmetics, perfumes, bath and nail products in 2025, and $95,362 million at hair salons and grooming businesses. (U.S. Bureau of Economic Analysis)See details
The Census Bureau counted 838,264 beauty salons with no employees in 2023, nearly ten (9.96) for every salon with a payroll. (U.S. Census Bureau; our calculation)See details
48.1% of U.S. hairdressers, hairstylists and cosmetologists were self-employed in 2025, against 5.8% of all workers. (U.S. Bureau of Labor Statistics)See details
Beauty brands report spending a fifth to a third of sales on advertising and promotion: 32.2% at L'Oréal and 32.7% at Puig in 2025, and about 24% on marketing and digital at e.l.f. Beauty. (Company filings)See details
The Census Bureau's expense survey sees only $177,946 thousand of advertising bought by cosmetics makers in 2024, about 0.5% of their shipments, because most brand marketing is booked outside the factories it surveys. (U.S. Census Bureau; our calculation)See details
79.2% of L'Oréal's media investment was digital in 2025, and Unilever puts digital at more than 70% of its brand and marketing investment. (L'Oréal; Unilever)See details
Unilever's beauty division worked with 180,000 content creators in 2025, up from 75,000, and its chief executive said the life span of a video is now four days. (Unilever)See details
TikTok Shop took 10% of U.S. beauty e-commerce in early 2026, but about 2% of all U.S. beauty sales by McKinsey's estimate. (Circana; McKinsey & Company)See details
Just 7% of consumers in Europe, the U.S. and China said in 2025 they had recently discovered a beauty brand through an influencer, down from 16% in 2023. (McKinsey & Company)See details
YouTube counted more than 6 billion views of videos with "GRWM" in the title between January and early June 2023. (YouTube)See details
About 57% of UK influencer ads were adequately disclosed in 2024, and health and beauty drew 9,323 complaints to the UK's ad regulator in 2025, more than any other sector. (Advertising Standards Authority)See details
The popular claim that creators own 97% of beauty on YouTube is the other side of a 2014 count by Pixability, a YouTube ad-buying firm, that brands had 3% of 14.9 billion beauty video views. (Pixability, 2014)See details
Fenty Beauty's much-quoted $72.0 million first month was earned media value, a vendor's estimate of what social posts would have cost as ads, not sales. (WWD, reporting Tribe Dynamics)See details
How big is the U.S. beauty industry?
Americans spent $75,854 million (about $75.9 billion) on cosmetics, perfumes, bath and nail products in 2025, and $95,362 million (about $95.4 billion) at hair salons and other personal grooming businesses (U.S. Bureau of Economic Analysis, personal consumption expenditures). In current dollars, spending on the products is up 52.7% since 2019 and spending at salons and grooming businesses is up 27.6% (our calculation, not adjusted for inflation). The average U.S. household spent $978 on personal care products and services in 2024, 1.2% of its spending, and $499 of that went on products rather than services (U.S. Bureau of Labor Statistics, Consumer Expenditure Surveys).
The Census Bureau counts the businesses behind that spending. In 2023 the U.S. had 84,176 beauty salons with paid employees, employing 391,064 people in mid-March, plus 34,417 nail salons and 17,328 cosmetics, beauty supply and perfume stores employing 188,956 (U.S. Census Bureau, County Business Patterns). Most beauty businesses have no staff at all. 838,264 beauty salons with no employees filed business tax returns for 2023 (U.S. Census Bureau, Nonemployer Statistics), about 9.96 for every salon with a payroll (our calculation; the two series count slightly different units, so treat it as roughly ten to one).
Measure
Figure
Year
Consumer spending on cosmetics, perfumes, bath and nail products (BEA)
The one-person salon is growing while salon payrolls shrink. Paid employment at beauty salons fell from 445,249 in March 2019 to 391,064 in March 2023, down 12.2%, while beauty salons with no employees rose from 757,926 in 2019 to 867,242 in 2024, up 14.4% (Census figures above and County Business Patterns 2019, Nonemployer Statistics 2019; our calculation). Counted together, beauty salons took in roughly $54.2 billion in 2024, about 49.3% of it at salons with no employees (our calculation; approximate, because one survey counts firms and the other counts tax filings). The Census Bureau's 2022 owner data count 794,248 female-owned firms among 894,503 beauty salon firms, about 88.8% (U.S. Census Bureau, Nonemployer Statistics by Demographics; our calculation).
Hair is most of the salon business. Hair care services made up 72.3% of beauty salons' revenue in 2022, and retail sales of cosmetics and fragrances just 1.9% (U.S. Census Bureau, 2022 Economic Census). On the manufacturing side, the 2022 Economic Census put shipments of creams, lotions and oils at $8,692,378 thousand, cosmetics at $5,852,185 thousand and hair preparations at $5,858,092 thousand (U.S. Census Bureau, 2022 Economic Census product lines; cosmetics; hair preparations).
Worldwide figures are company estimates, not official statistics. L'Oréal puts the global beauty market at some €300 billion in 2025, at manufacturer prices, up from more than €290 billion in 2024, and estimates growth of about 3.5% in 2025 (L'Oréal 2025 Universal Registration Document; 2024 edition; growth). McKinsey expects the market to reach $590 billion by 2030 (McKinsey & Company), and NielsenIQ measured global beauty sales growth of 10% in the year to early 2026, with e-commerce growing six times faster than stores (NielsenIQ). The estimates use different scopes and prices, so they do not line up. Unilever's Beauty & Wellbeing business alone had turnover of €12.8 billion in 2025 (Unilever Annual Report 2025).
How many people work in beauty, and how many work for themselves?
Almost half of U.S. hairdressers work for themselves: 48.1% of the 595,000 hairdressers, hairstylists and cosmetologists BLS counted in 2025 were self-employed, against 5.8% of all workers (U.S. Bureau of Labor Statistics, Employment Projections; all occupations). That matters for anyone counting the beauty businesses that make their own video: most are one-person operations.
Occupation
Wage and salary jobs, May 2025
Median annual wage, May 2025
Hairdressers, hairstylists and cosmetologists
305,710
$35,790
Manicurists and pedicurists
152,770
Not shown
Skincare specialists
72,890
$45,330
Makeup artists, theatrical and performance
2,340
$97,150
Source: U.S. Bureau of Labor Statistics, Occupational Employment and Wage Statistics, May 2025 (hairdressers, wage; manicurists; skincare, wage; makeup artists, wage). These counts leave out the self-employed, which is why the hairdresser figure is about half of BLS's all-worker count. OEWS is not designed for comparisons between years.
BLS projects employment of personal appearance workers to grow 7.8% from 2025 to 2035 (BLS Employment Projections), and skincare specialists 9%, much faster than average. Among the reasons the Occupational Outlook Handbook gives for the skincare growth is the desire of many women and a growing number of men "to look good on social media platforms" (BLS Occupational Outlook Handbook). It is a qualitative explanation, not a measured share of demand.
How much do beauty companies spend on advertising?
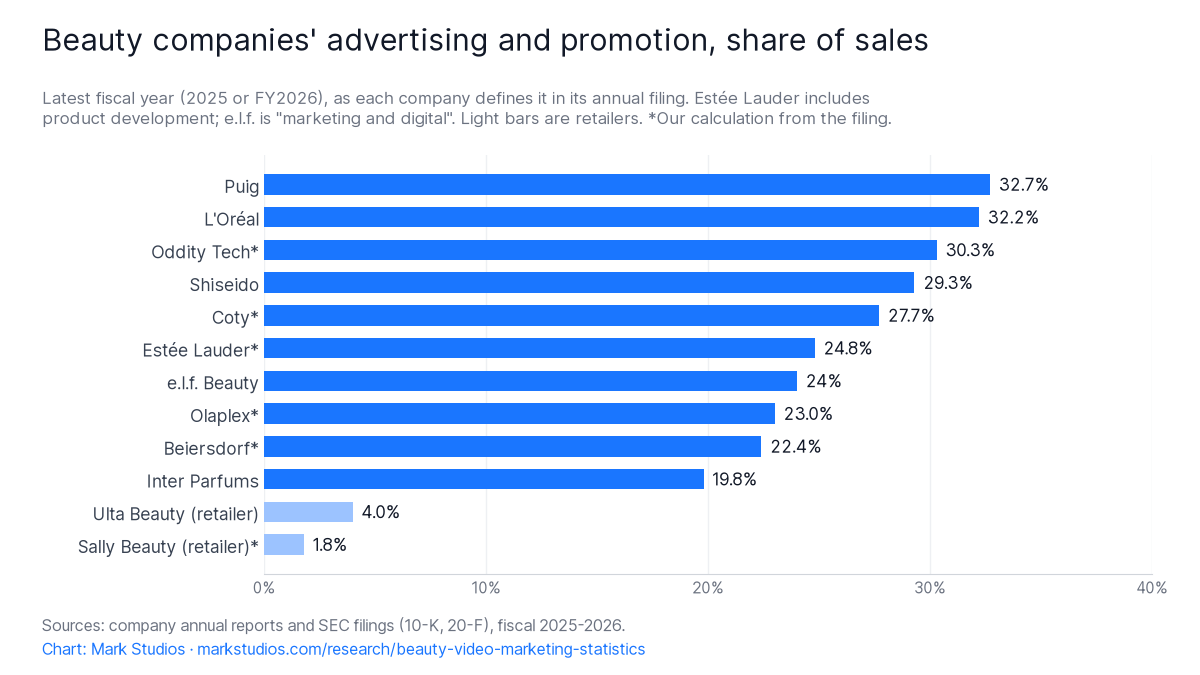
The big beauty brands put roughly a fifth to a third of their sales into advertising and promotion, by their own filings: 32.2% at L'Oréal in 2025, 32.7% at Puig and about 24% of net sales on "marketing and digital" at e.l.f. Beauty in its fiscal 2026 (L'Oréal 2025 Universal Registration Document; Puig 2025 results; e.l.f. Beauty fiscal 2026 Form 10-K). The two retailers in the table report far smaller shares, and Ulta Beauty's figure is net of vendor income that reimburses specific advertising costs, by its own definition.
Beauty companies' advertising and promotion as a share of salesLatest fiscal year (2025 or fiscal 2026), as each company defines it in its annual filing. Estée Lauder includes product development; e.l.f. Beauty's figure is "marketing and digital". Lighter bars are retailers. * Our calculation from the same filing.
The shares barely move from year to year. L'Oréal spent €14,008.9 million in 2024, also 32.2% of sales (L'Oréal 2024 Universal Registration Document); Shiseido ¥283.3 billion, 28.6% of net sales (Shiseido); Ulta Beauty $431,455 thousand, 3.8% (Ulta Beauty fiscal 2024 Form 10-K); Beiersdorf €2,257 million (Beiersdorf). In the fiscal years before the latest, Estée Lauder's line was $3,643 million and Coty's $1,574.4 million (Estée Lauder; Coty); Coty said higher advertising and promotion added 100 basis points to its overhead ratio in fiscal 2026 (Coty Form 10-K). The largest consumer-goods advertisers report only company-wide totals: Procter & Gamble spent $10.2 billion on advertising in fiscal 2026 across all its brands, while its Beauty segment had $16,023 million of net sales, and Kenvue, which owns Neutrogena, spent $1,836 million in 2025 (Procter & Gamble Form 10-K; same filing; Kenvue Form 10-K).
At e.l.f. Beauty, advertising costs went from $96.7 million in fiscal 2023 to $281.5 million in fiscal 2025 and $361.3 million in fiscal 2026, about 3.7 times in three years, as net sales reached $1,636.5 million (e.l.f. fiscal 2025 Form 10-K; same filing; our calculation). Its broader marketing and digital line was $318.8 million in fiscal 2025 (e.l.f. fiscal 2025 Form 10-K). Oddity Tech, which sells almost entirely online, warned in its annual report that it expects challenges in 2026 from difficulty acquiring new customers cost-efficiently (Oddity Tech 2025 Form 20-F).
Government data barely see this money. The Census Bureau's survey of business expenses found U.S. cosmetics and toiletry manufacturers bought only $177,946 thousand of advertising from outside providers in 2024, and $206,336 thousand in 2023 (U.S. Census Bureau, Annual Integrated Economic Survey; 2023). That is about 0.5% of their shipments (our calculation), against the 20% to 33% the brands report. The survey counts only advertising that establishments classed as manufacturers buy from outside firms, so spend booked by headquarters, sales offices or in-house teams falls outside it. Even inside one company the line moves: Kenvue raised the advertising it had disclosed for 2024 by $234 million after finding some retail media spend had been classified inconsistently (Kenvue fiscal 2025 Form 10-K).
How much of beauty marketing goes to digital media and creators?
At the two companies that publish a split, most of the media money goes to digital: L'Oréal says 79.2% of its media investment was digital in 2025, up from 78.6% in 2024, and Unilever says digital was more than 70% of its brand and marketing investment in 2025, up from 40% in 2021 (L'Oréal 2025 Universal Registration Document; 2024 edition; Unilever CAGNY 2026 presentation). Neither company says how much of the digital share buys video.
At Unilever, the creator count more than doubled in a year while total brand and marketing investment edged down, from €8,378 million in 2024 to €8,142 million (restated without ice cream). Its chief executive told investors in February 2026 that 180,000 content creators were working for its Beauty & Wellbeing division, against 75,000 the year before, about 2.4 times as many, and close to 300,000 across the company (Unilever CAGNY 2026 transcript). In the same talk he said the beauty business made seven times as many content assets in 2025, doubled how often it posts, and that "the life span of a video now is four days" (Unilever). For one brand, Dove, Unilever's slides count more than 11K creators in 2025, up from 3,000 in 2022 (Unilever CAGNY 2026 presentation). Unilever does not define what counts as a creator working for it.
L'Oréal measures creators as a market. It reports a 26% "share of influence" in creator media in 2025, and in 2024 reported a 27.8% "influencer market share"; the wording changed between the two reports, so the move should not be read as a fall (L'Oréal 2025; L'Oréal 2024). It says its generative-AI content lab makes it possible to produce more than 495,000 marketing assets a month, and that AI campaigns took 20% of its investment on digital platforms in 2025 (L'Oréal 2025 Universal Registration Document). Its creator collaborations with Meta had passed 100 million views by 2024 (L'Oréal).
The U.S. filings say the same thing in words rather than numbers. e.l.f. Beauty's fiscal 2026 10-K lists Snapchat, Facebook, TikTok, X, Roblox, Twitch, Pinterest, Instagram and YouTube as marketing tools, names TikTok Shop as a place its products sell, and warns that it relies "in part upon social media influencers" it cannot fully control (e.l.f. Beauty fiscal 2026 Form 10-K). Ulta Beauty says it is directing a "growing percentage" of its marketing expense to digital, social media and streaming advertising (Ulta Beauty fiscal 2025 Form 10-K); its fiscal 2024 report had named TikTok among its accounts, and the fiscal 2025 report names no platforms (Ulta Beauty fiscal 2024 Form 10-K). Sally Beauty names Instagram, TikTok and Facebook (Sally Beauty fiscal 2025 Form 10-K). Estée Lauder says prestige beauty discovery increasingly happens across social platforms, "creator ecosystems", marketplaces, search engines and emerging AI models (Estée Lauder fiscal 2026 Form 10-K). None of these filings states what share of spending goes to creators or to video.
What do the platforms say about beauty video?
The platforms mostly publish views and hours, not sales: YouTube says videos with "GRWM" (get ready with me) in the title drew more than 6 billion views worldwide between January 1 and June 5, 2023, and Snap says Snapchatters watched more than 262 million hours of beauty content on Spotlight in 2024, counting January 1 to November 13 (YouTube Culture & Trends; Snap Inc.). YouTube also says daily GRWM uploads in 2023 were 4x the year before (YouTube), and that GRWM Shorts drew more than 7.2 billion views in India alone in 2024 (YouTube India Culture & Trends). Snap counts nearly 113 million Snapchatters who tried a sponsored beauty Lens over the same period (Snap Inc.). Each of these is the platform's own count, from a company that sells advertising to beauty brands.
Google's older figures are still widely quoted. It reported that watch time of "get ready with me" videos rose 24% in North America in early 2015 (Think with Google), that watch time for beauty YouTubers' videos grew more than 75% in the U.S. between 2017 and 2018 (Think with Google), and that 86% of the top 200 beauty videos on YouTube in a May 2017 study were made by creators rather than "branded or professional content" (see what that figure covers). In a 2017 analysis, 90% of top beauty videos about aloe did not mention a brand (Think with Google), and YouTube's head of fashion and beauty wrote that 95% of 2018's beauty content fell into three groups: inspiration, education and access (Think with Google). These are seven to eleven years old.
When the platforms survey shoppers, they commission the survey and publish the result, with very different amounts of method. The table lists what each one disclosed.
Platform
Finding
Who was asked
Snap Inc.
9 in 10 shoppers say social media influences their beauty or personal care purchases; 77% of those who engage with creators buy products creators launched or endorsed
9,000+ consumers in six markets, Ipsos and WPP Media, 2025; field dates not given
Snap Inc.
Almost 80% of beauty buyers interested in AR experiences
Same survey
Pinterest
85% of weekly users found beauty trends on Pinterest before seeing them elsewhere; 64% say it is better for current trends
U.S. weekly Pinterest users with recent beauty purchases, Talk Shoppe, August 2025; sample size not given
TikTok
51% of users who use skincare or cosmetics discover beauty products on TikTok
Global survey of TikTok users, June 2023
TikTok
69% of Italian users more likely to buy a new beauty brand after seeing it on TikTok
500 Italian TikTok users, 2023
TikTok
1 in 4 users bought something new after a beauty video; 26% inspired to look up a brand by tutorials
TikTok users in its European region, 2022; sample size and countries not given
TikTok
80% say TikTok content directly influences the products in their beauty routine
No method published
TikTok
91% of EU users discovered new-to-them makeup techniques on TikTok
No method published beyond TikTok's 2025 beauty playbook
Meta
80% of Indian beauty shoppers discover brands on social media, and 92% of those on Meta's apps; 1 in 3 (33.3%) bought after watching Instagram Reels; 75% say virtual try-ons encourage online buying
Beauty shoppers in India, GWI for Meta, 2023
Google
89% of beauty shoppers say YouTube helps them buy with more confidence
Beauty shoppers in India, MTM for YouTube; sample not given
Google
45% of U.S. beauty shoppers watched a YouTube how-to using the product, for inspiration, before buying
1,745 U.S. beauty shoppers within a survey of 8,040 consumer-goods shoppers, Google and Deloitte, 2017
Google
U.S. beauty consumers name YouTube their No. 1 digital source for beauty content
420 U.S. women, Google and Kantar TNS, November 2018
Instagram
45% of beauty buyers researching on Instagram trust the people providing content because of a personal connection
Pinterest reports search trends rather than views: global searches for "cluster lashes ideas" rose 646% from July 2025 to July 2026 (Pinterest). TikTok said in February 2022 that the #TikTokMadeMeBuyIt hashtag had 6.4 billion views, across every product category, not beauty alone (TikTok).
How much beauty is sold through TikTok Shop and social commerce?
Still a small share of all beauty sales, growing fast: Circana says TikTok Shop took 10% of U.S. beauty e-commerce sales in the first quarter of 2026, and McKinsey estimates TikTok at about 2% of all U.S. beauty sales, with its beauty sales rising about 260% a year since 2023 (Circana; McKinsey & Company). McKinsey projects U.S. beauty sales on TikTok of $4 billion in 2026 (McKinsey). NielsenIQ reported in February 2025 that TikTok Shop had become the eighth-largest e-commerce health and beauty retailer in the U.S., with $1 billion in beauty sales; the release does not give the period (NielsenIQ). TikTok itself publishes no U.S. beauty sales figure for TikTok Shop; the dollar totals that circulate come from third-party trackers.
For scale, Circana puts U.S. prestige beauty sales at $36 billion in 2025 and beauty sold through mass retailers at $72.7 billion, and reports prestige sales of $17.1 billion in the first half of 2026, up 7% (Circana; mass; first half 2026). Circana tracks the two channels separately.
Measure
Circana
Euromonitor
Beauty and personal care share of U.S. TikTok Shop sales
20% (Q1 2026, dollar spending)
About 6% (2024)
Sources: Circana; Euromonitor International. Both call beauty TikTok Shop's top category. Euromonitor's release words its figure as beauty "accounting for about 6% of US TTS sales", and the two measure different periods with different panels. We show both rather than pick one.
The brands' own filings show how much of their selling is already online. L'Oréal made 30.2% of its 2025 sales online (€13.3 billion), up from 28.2% in 2024, and names Amazon and ByteDance, TikTok's owner, among its growth drivers (L'Oréal 2025; 2024). L'Oréal also states that e-commerce accounts for a quarter of beauty product sales worldwide (L'Oréal). e.l.f. Beauty made 24% of fiscal 2026 net sales through e-commerce, including TikTok Shop, which its 10-K names as a sales channel alongside Amazon (TikTok Shop; e.l.f. fiscal 2026 Form 10-K). Oddity Tech sold 97% of 2025 revenue through its own websites (Oddity Form 20-F); Sally Beauty, a store chain, made 10.7% of fiscal 2025 sales online (Sally Beauty Form 10-K). Ulta Beauty had more than 46 million loyalty members, who accounted for about 95% of its sales in fiscal 2025 (Ulta Beauty Form 10-K; same filing).
Unilever has given two different e-commerce figures for its beauty business. In September 2025 its chief executive said 30% of Beauty & Wellbeing was already e-commerce; a February 2026 investor slide put digital commerce at 17% of Beauty & Wellbeing and Personal Care turnover combined (Unilever, Barclays conference transcript; Unilever CAGNY 2026 presentation). The two cover different business groups, and Unilever does not reconcile them. In China, the chief executive said, its business on Douyin and TikTok Shop is growing more than 50% (Unilever CAGNY 2026 transcript). Beiersdorf reported organic e-commerce growth of 20% in 2025 and extended TikTok Shop selling for NIVEA to Germany, Italy and Mexico (Beiersdorf Annual Report 2025).
Live shopping is where video and checkout meet, and adoption varies widely by country. In McKinsey's 2025 consumer survey, 13% of U.S. consumers said they had attended a live-stream shopping show in the past year, against 41% in China and 8% in Europe (McKinsey). TikTok says beauty live-shopping sessions on TikTok Shop UK grew 90% in 2025, that TikTok Shop is the UK's fourth-largest beauty retailer on NielsenIQ 2024 data, and that UK beauty sales grew 60% (TikTok newsroom); its UK head of beauty said one beauty product sells on TikTok Shop "every single second" (TikTok newsroom). The founder of Canvas Beauty sold more than $2 million in one Black Friday 2024 live session, a single record, not a typical result (TikTok newsroom). TikTok publishes no method or base for these growth rates. In fragrance, Circana's predecessor NPD found TikTok accounted for 45% of U.S. social-media-driven fragrance purchases in 2022 (Circana).
How do shoppers use social video to find beauty products?
About 3 in 10 U.S. adults who use social media said in 2022 that they had bought something after seeing an influencer or content creator post about it, including 36% of women and 21% of men, according to Pew Research Center (Pew Research Center; same survey). Among women aged 18 to 29, 62% said influencers affect what they buy at least a little (Pew). The question covered all products, not beauty alone.
Influencers may be losing ground as the place people first hear of a beauty brand. In McKinsey and The Business of Fashion's 2025 survey, just 7% of consumers in Europe, the U.S. and China said they had recently discovered a beauty brand through an influencer, down from 16% in 2023, and 18% of consumers worldwide named influencers their most trusted source of beauty information (McKinsey & Company, State of Beauty 2025; same report). Sellers of marketing services report higher numbers. Tinuiti, an agency that sells to beauty brands, found in a January 2025 survey of beauty shoppers that 38% recalled social media as where they first saw a beauty product they later bought, the top answer; 62% of Gen Z said they had discovered and bought a beauty product through social media in the past year, against 19% of baby boomers (Tinuiti; same survey). In March 2026, 30% of 1,050 U.S. beauty shoppers told Tinuiti they buy beauty products through TikTok Shop (Tinuiti).
Which platform matters depends on age. Among Tinuiti's beauty shoppers who discover products on social media, Facebook led at 26% and YouTube came second at 24%, with TikTok at 17%; TikTok led only among Gen Z (Tinuiti). 21% said they regularly watch "get ready with me" videos (Tinuiti). Attest, a survey software company, found 53% of U.S. Gen Z consumers using TikTok for beauty content in early 2026, up from 46%, while YouTube fell from 33% to 25% (Attest). Across all U.S. adults, YouTube still reaches the most people: 84% use it, against 37% for TikTok, and 55% of women use Instagram and 42% use TikTok (Pew Research Center, 2025; TikTok; Instagram; by gender).
Teen figures depend heavily on who asks. Pew's probability panel and Piper Sandler's school survey disagree by double digits, so the table shows both.
U.S. teens using
Pew Research Center (ever use, fall 2025)
Piper Sandler (monthly use, spring 2025)
Instagram
63%
87%
TikTok
68%
79%
YouTube
92%
Not compared
Sources: Pew Research Center (Instagram, TikTok, YouTube), a national probability panel of teens aged 13 to 17; Piper Sandler, Taking Stock With Teens (Instagram, TikTok), students reached through schools. Monthly use should be lower than ever use, so the gap comes from who was sampled, not from the question.
Pew found 61% of teens use TikTok every day (Pew). In Piper Sandler's fall 2025 survey, 85% of female teens wore makeup, 36% named e.l.f. their favorite cosmetics brand, 46% of all teens named TikTok their favorite app, and 27% named YouTube their main daily video source; teens' self-reported yearly beauty spending was $336, down from $374 in the spring (Piper Sandler; brands; apps; video; spending; spring 2025). Piper Sandler is an investment bank that sells this research to clients. A small Rutgers-led study of 143 New Jersey high-school students found those who watched hair or beauty tutorials reported using 40% more personal care products in the previous day (Rutgers University). It is one small sample and shows an association, not a cause.
What rules apply to beauty video ads and influencer posts?
Health and beauty ads draw more complaints than any other sector in the UK and Europe: health and beauty was the most complained-about sector at the UK's Advertising Standards Authority in 2025, with 9,323 complaints, up 64% on 2024, and the largest category across European advertising self-regulators in 2024, at 23% of complaints, up from 10% (Advertising Standards Authority; European Advertising Standards Alliance). Both categories include health products, not only cosmetics. Influencer marketing drew 22% of the online advertising complaints that European self-regulators could break down in 2024 (EASA).
Regulators who check influencer posts keep finding that many ads are not labelled well enough. The table collects the published checks.
Check
What was looked at
Result
UK, CAP monitoring, September 2020
5,732 ads in the Instagram Stories of 122 UK influencers
35% clearly labelled as ads
UK, ASA monitoring, 2024
Influencer ads on Instagram and TikTok
About 57% adequately disclosed; Instagram 55%, TikTok 60%
UK, the same 122 accounts, 2024
Accounts first monitored in 2021
49% adequately disclosed, up from 35%
EU, European Commission sweep, 2023
576 influencers checked by authorities in 22 member states
20% systematically labelled ads; 40% kept the label visible for the whole post or video
France, DGCCRF, 2022-23
More than 300 influencers, including beauty influencers
In the EU sweep, beauty was one of the main sectors of the influencers checked, after fashion, lifestyle, beauty in that order (European Commission), and 38% of influencers did not use platform labels such as Instagram's paid-partnership tag (European Commission). The Commission gave two different shares for influencers registered as traders: 36% in its press release and 47% on its sweeps page, probably on different bases (press release; sweeps page). The ASA received over 3,500 complaints about undisclosed social media ads in 2024 and resolved 3,335 complaints about influencer ads in 2025 (ASA; ASA); 26 influencers had been taken off its public list of non-compliant accounts after changing how they label ads, as of October 7, 2026 (ASA).
Filters are where the rules get specific to beauty. In February 2021 the ASA upheld two rulings against tanning brands whose influencers had used beauty filters that changed their skin tone in Instagram Stories, and told influencers and advertisers to avoid filters likely to exaggerate a product's effect (ASA); one ruling, on Tanologist Tan, was published on 03 February 2021 (ASA ruling). France's June 2023 influencer law, as first published, requires the label "images retouchées" on influencer images edited to change a face or body, visible for the whole video, with breaches punishable by a year in prison and a fine of 4 500 euros (€4,500), and requires paid promotions to be labelled "publicité" or "collaboration commerciale", with fines of up to 300 000 euros (Journal officiel; Article 5 I). Norway has required labels on ads with retouched bodies or skin since 1 July 2022 (Lovdata, Marketing Control Act).
In the U.S., the Federal Trade Commission's revised Endorsement Guides took effect on July 26, 2023, the first revision since 2009, and the FTC added 40 questions to its influencer FAQ (Federal Register; FTC; FTC). Its guidance for influencers, published in November 2019, says a disclosure for an endorsement made in a video belongs in the video itself, not only in the description (FTC, Disclosures 101 for Social Media Influencers). Its rule against fake reviews and testimonials took effect on October 21, 2024, when the maximum civil penalty was $51,744 per violation (Federal Register); the ceiling is now $53,088 (eCFR, 16 CFR 1.98), and FTC staff sent warning letters under the rule to 10 companies in December 2025 (FTC). In October 2021 the FTC sent a notice on deceptive endorsements to more than 700 companies (FTC); the recipient list includes Coty, Estée Lauder, Kylie Cosmetics, LLC, L'Oréal USA and Ulta Beauty, and the FTC says being on it does not mean a company did anything wrong (FTC recipient list). FTC staff first wrote directly to influencers in April 2017, in more than 90 letters (FTC), and on October 21, 2019 it announced a settlement with Sunday Riley Modern Skincare over fake reviews posted by employees (FTC).
Industry self-regulation reaches into TikTok videos too. In a November 2024 case, BBB National Programs' National Advertising Division found that TikTok videos reviewing a Drunk Elephant product did not clearly disclose the brand's connection to the creators (BBB National Programs), and in May 2025 it reviewed a "strongest setting spray ever" claim made in an influencer's TikTok video, in a challenge Charlotte Tilbury brought against Huda Beauty (BBB National Programs).
The product rules changed too. The Modernization of Cosmetics Regulation Act became law on December 29, 2022, which the FDA calls the biggest expansion of its cosmetics authority since 1938 (FDA; FDA). By June 30, 2026, the FDA counted 16,398 active cosmetic facility registrations and 1,298,361 active product listings (FDA). In the UK, the Competition and Markets Authority secured commitments from 16 celebrities and influencers to label paid endorsements in 2019, and since April 2025 it can fine companies up to 10% of global turnover for consumer law breaches (CMA; CMA). The EU's planned Digital Fairness Act, on which the Commission consulted from July to October 2025, was listed with an indicative date of Q4 2026 as of September 2026 (European Parliament Legislative Train). None of this is legal advice.
What the popular beauty video statistics really say
Lists of "beauty video marketing statistics" lean on a small set of numbers from 2014 to 2017, several of which changed meaning as they were copied. We traced eight of the most repeated to the earliest document we could read. Pages that repeat a claim are linked only as dated evidence of how it changed, never as a source for the number.
"Creators own 97% of beauty on YouTube"
This is the other side of a 2014 count by a company that sells YouTube ad buying. On February 4, 2014, Pixability said major beauty brands had "only garnered 3%" of the 14.9 billion beauty-related video views it counted on YouTube (Pixability, via Internet Archive). The 97% is simply the remaining views, most of which went to creators. The same day, ClickZ wrote that creators "control 97 percent of conversations around beauty topics", turning a share of views into a share of conversations (ClickZ), and Tubefilter gave the total as 14.4 billion views (Tubefilter). Google's own UK event report that September restated it as brands controlling only 5% of a larger total (Think with Google UK, Beauty@Google 2014).
Pixability's own later counts moved. Its June 2015 update counted 45.3 billion views across 1.78 million beauty videos from 215 brands and 182,621 creators, for brands with a mainly English-language channel (Pixability), and a 2016 study put brands at 2.6% of beauty conversations across six social platforms (Cosmetics Business, reporting Pixability). Use any of these as a dated snapshot from a vendor, not as a current share. No platform publishes the split today.
"86% of top beauty videos are made by creators"
This one is Google's, and narrower than it sounds. A Think with Google data card says 86% of the top 200 beauty videos on YouTube were made by creators "vs. branded or professional content", citing a Nielsen, Carat and YouTube study from May 2017 (Think with Google, via Internet Archive). It covers 200 videos, not beauty video as a whole, and the other 14% includes professional media uploads as well as brands. The same figure had already appeared in September 2016, in coverage of a Pixability study that said 86 percent of the top 200 beauty YouTube videos are produced by creators (Jezebel, quoting WWD), so the number may be older than the study Google cites; and an influencer-platform blog in October 2016 recast it as 14 percent made by beauty brands, dropping the professional uploaders (ION).
"45% of beauty shoppers watch a YouTube tutorial before buying"
The source is a 2017 Google and Deloitte survey of U.S. shoppers, and the question was specific. Google's data card says 45% of beauty shoppers watched a YouTube "how-to" video that used the product, for inspiration, before buying a beauty product (Think with Google, via Internet Archive). A Google article from October 2018 gives the sample as 1,745 beauty shoppers, part of a survey of 8,040 consumer-goods shoppers (Think with Google, via Internet Archive). The same article's "spend over 40% more" compares shoppers who said they watched a brand's YouTube ad with those who did not, using self-reported spending; it shows a difference between groups, not an effect of the video (Think with Google). A second, unrelated 45% circulates as well: a 2015 agency blog citing Pixability says how-to videos make up 45 percent of beauty content on YouTube, a share of videos, not of shoppers (Brafton). Google's older "seventy percent of beauty purchasers" say YouTube videos influence what they buy dates from a May 2014 study with no published sample (Think with Google, via Internet Archive).
"89% bought a beauty product after watching a video"
Two different 89% figures get attached to beauty, and neither says what the lists claim. The first comes from Wyzowl, a company that makes explainer videos: its 2023 report says 89% of people say watching a video has convinced them to buy a product or service, from 528 respondents surveyed in November 2022, with no breakdown by product or by kind of video (Wyzowl, via Internet Archive). The figure moves every year; the 2026 edition says 85%, from 266 respondents (Wyzowl). We found no Wyzowl survey saying that 89% of consumers were convinced to buy a beauty product by a tutorial-style video, the version a shoppable-video vendor's glossary credits to Wyzowl (example).
The second comes from StyleSeat, a salon booking platform, whose August 2022 blog post says 89% of the TikTok users it surveyed had bought beauty products because of social media, and 57% of all social media users (StyleSeat). It was a one-day online survey of 1,020 U.S. social media users on August 19, 2022, and the post does not say how many of them used TikTok. By November 2023 an agency report charted it as the "share of users purchasing beauty products" on TikTok, 89%, credited to Statista (ChannelX).
"Fenty Beauty made $72 million in its first month"
That was earned media value, not sales. WWD reported on October 24, 2017 that Fenty Beauty recorded $72.0 million in earned media value in Tribe Dynamics' September 2017 ranking, third among cosmetics brands (WWD). Earned media value is a vendor's estimate of what social posts about a brand would have cost as paid advertising. Only $10.6 million of it was recorded on YouTube; most came from Instagram (WWD). The companion figure, 132 million, was Refinery29's report, citing an unnamed YouTube source, of 132 million YouTube views of Fenty Beauty-related content in the month after launch (Refinery29). Three days later Newsweek wrote that "about 132 million people watched Fenty Beauty tutorials" (Newsweek), a headline elsewhere called the $72 million a valuation (Black America Web), and a 2026 agency case study still pairs $72 million with 132 million YouTube views (TCF).
"#BeautyTok has billions of views"
These are readings of TikTok's hashtag counters on a given day, not statistics TikTok publishes. TikTok's own July 2021 "Welcome to #BeautyTok" post gives no total; it cites single hashtags as examples, such as 2.2 billion views on #skincarebyhyram (TikTok For Business, via Internet Archive). The widely repeated "#BeautyHacks has 12.5 billion views" came from a 2021 press survey of hashtag counters by a cosmetic surgery clinic (Scratch magazine), and eMarketer wrote in 2022 that #beauty had "107.8 billion views and counting" (eMarketer). Counters rise every day and count every video carrying the tag. Cite one only with the date you read it.
"The beauty industry is worth $532 billion"
This is a 2018 estimate from a market-research reseller, for 2017, on a wide definition. Orbis Research valued the global cosmetic products market at USD 532.43 billion in 2017, including oral care, soaps and shower gels (Orbis Research release). Adweek repeated it in September 2019 as the size of the global cosmetics market, $532.43 billion (Adweek), and later lists dropped the year. For the same year, L'Oréal estimated the world cosmetics market at €200 bn (L'Oréal 2017 Annual Report). The current company estimates are in the first section of this page; whichever you use, give its year and its owner.
"Unilever is moving half its media spend to social"
The numbers in this one were said by the interviewer. In Unilever's own transcript of a Barclays fireside chat on March 6, 2025, the analyst asking the questions says "you're moving to a social-first advertising strategy, 30% of total spend to 50%", and the chief executive's answer does not repeat the figures (Unilever transcript). On March 11, Campaign Asia put "30% to 50%" in quotation marks as the chief executive's words (Campaign Asia) and Fortune reported that he planned to raise social spending to 50% of the ad budget (Fortune). On March 13 a trade site printed a direct quote, "will move from 30% to 50% of our total spend", that does not appear in Unilever's transcript (FoodIngredientsFirst), and by August 2025 a marketing blog had it as 50% of ad spend committed to influencer marketing and social media (KeywordSearch). We did not listen to the webcast audio. What Unilever has put in writing is above: digital at more than 70% of brand and marketing investment, and 180,000 creators in its beauty division.
How we built this page
We started from the questions people search for about beauty video marketing statistics and looked for the organization that actually produced each answer. Every figure on this page sits in an evidence ledger with its source, the exact table or paragraph it came from, the measurement period, the population measured, and the date we checked it. This edition holds 288 figures from 65 publishers.
On October 7, 2026, each of the 263 sourced figures on this page that has a web source was re-fetched with the fetch cache cleared and matched against the recorded wording, and the 7 BLS occupational estimates were checked against their series in the BLS public data API. Pages that have moved or block automated requests, including Think with Google, Pixability, Wyzowl, Euromonitor, an Instagram Business post, a TikTok For Business post and the French government's sites, were checked against dated Internet Archive copies. We left out what we could not re-check or could not use: NielsenIQ's figures on how many consumers buy beauty through social platforms, which come with no sample, geography or dates; the full Tinuiti 2026 beauty report, which is handed out through a sign-up form; U.S. TikTok Shop beauty sales totals from third-party trackers, because TikTok publishes none; a CAP figure for beauty's share of influencer ads that can only be read from a chart image; and a column of the ASA's 2025 complaints table whose percentages do not match its own counts.
We only cite the producer: government agencies, regulators, company filings and official posts, and the survey owner's own report. We do not cite statistics roundups, Statista-style aggregators, or salary sites without a public method. We did not bypass paywalls or sign-up forms; where a full report was gated, we used only the figures its publisher states publicly.
Figures marked "our calculation" are arithmetic on the cited numbers, and anyone can reproduce them:
This edition contains no Mark Studios customer data.
Limitations
No source measures what beauty brands spend on video. Company filings report advertising and promotion in total, sometimes with a digital share; none splits out video, creators or production. The Census Bureau's expense survey counts only advertising bought from outside providers by establishments it classes as manufacturers.
Companies define advertising differently. Some include product development, store displays or trade promotion; some report for groups that sell far more than beauty. The spend table shows each company's own definition, so compare the ranking, not small gaps.
Most consumer figures come from organizations with an interest. TikTok, YouTube, Google, Meta, Pinterest and Snap sell advertising to beauty brands and commissioned the surveys they publish; Tinuiti sells marketing services; Piper Sandler, Circana, NielsenIQ, Euromonitor and McKinsey sell research or advice to the industry. Pew Research Center and the government sources do not.
Several platform figures have no published method, and some are old. Where a platform gives no sample, dates or base, the page says so. Many of the most quoted Think with Google figures date from 2014 to 2018.
Executives' spoken figures are not audited numbers. Unilever's creator counts and its line on the life span of a video come from investor presentations and transcripts, not from its audited accounts.
Most figures describe the U.S. Company figures are worldwide unless stated, and some platform surveys cover only India, Italy, the UK or TikTok's European region; each is labelled.
Rules change. The rules section describes laws and guidance as they read on the access date, and the French law as first published in June 2023. It is not legal advice.
How to cite this page
For a single figure, cite the original publisher named next to it, and link here if the verification trail is useful to your readers. Each figure has its own anchor, so you can link straight to it, for example https://www.markstudios.com/research/beauty-video-marketing-statistics#INT-004. To cite the page as a whole:
Mark Studios. "Beauty Video Marketing Statistics." Last verified Oct 7, 2026. https://www.markstudios.com/research/beauty-video-marketing-statistics
Our calculations and the evidence table are free to reuse with attribution and a link to this page. Each underlying figure remains the claim of its original publisher, and some publishers ask for a link when their figures are reused.
We re-verify every figure quarterly and when a major source publishes a new edition. The next scheduled review is January 2027. Corrections go to contact@markstudios.com.
Oct 7, 2026: First published with 288 figures from 65 publishers, each checked against its original source.
Frequently asked questions
How much do beauty brands spend on advertising?
Roughly a fifth to a third of sales, by their own filings. L'Oréal spent 32.2% of sales on advertising and promotion in 2025 and Puig 32.7%; e.l.f. Beauty put about 24% of net sales into marketing and digital in fiscal 2026. Retailers spend much less of their own money: Ulta Beauty's net advertising was 4.0% of net sales.
How much of beauty marketing is spent on digital and social media?
Most of it, where companies say. L'Oréal reports that 79.2% of its media investment was digital in 2025, and Unilever says digital was more than 70% of its brand and marketing investment. No beauty company publishes the share spent on video or on creators.
How many creators do beauty brands work with?
Unilever's chief executive said 180,000 content creators worked for its Beauty & Wellbeing division in 2025, up from 75,000 the year before. For its Dove brand alone, Unilever counts more than 11K creators.
How big is TikTok Shop in beauty?
Circana says TikTok Shop took 10% of U.S. beauty e-commerce sales in the first quarter of 2026. Across all U.S. beauty sales, online and in stores, McKinsey puts TikTok at about 2% and projects $4 billion of U.S. beauty sales on TikTok in 2026.
Do influencers still drive beauty purchases?
Some, but less than often claimed. Pew found that 36% of U.S. women on social media had bought something after an influencer's post. In McKinsey and The Business of Fashion's 2025 survey, just 7% of consumers said they had recently discovered a beauty brand through an influencer, and 18% named influencers their most trusted source of beauty information.
How many beauty salons are there in the U.S.?
The Census Bureau counted 84,176 beauty salons with paid employees in 2023 and 867,242 beauty salons with no employees in 2024, most of them sole proprietors.
What are the disclosure rules for beauty influencer videos?
In the U.S., the FTC's influencer guidance, published in November 2019, says a disclosure for an endorsement made in a video belongs in the video itself, and its rule against fake reviews and testimonials carries a maximum civil penalty of $53,088 per violation. In the UK, the ASA has ruled against beauty ads that used filters exaggerating a product's effect. France's 2023 influencer law, as first published, requires an "images retouchées" label on edited images.
Do creators really make 97% of beauty content on YouTube?
That figure comes from a 2014 count by Pixability, a company that sells YouTube ad buying: brands had 3% of the 14.9 billion beauty video views it counted, so the 97% is everything else. Pixability's own 2015 update counted 45.3 billion views. It is a dated vendor snapshot of views, not a share of content or conversations, and no platform publishes the split today.