Free video industry charts

Charts from our research pages, free to use in your article, deck or report with a credit link. Each one is drawn from figures we checked at the original source, and the chart names that source.

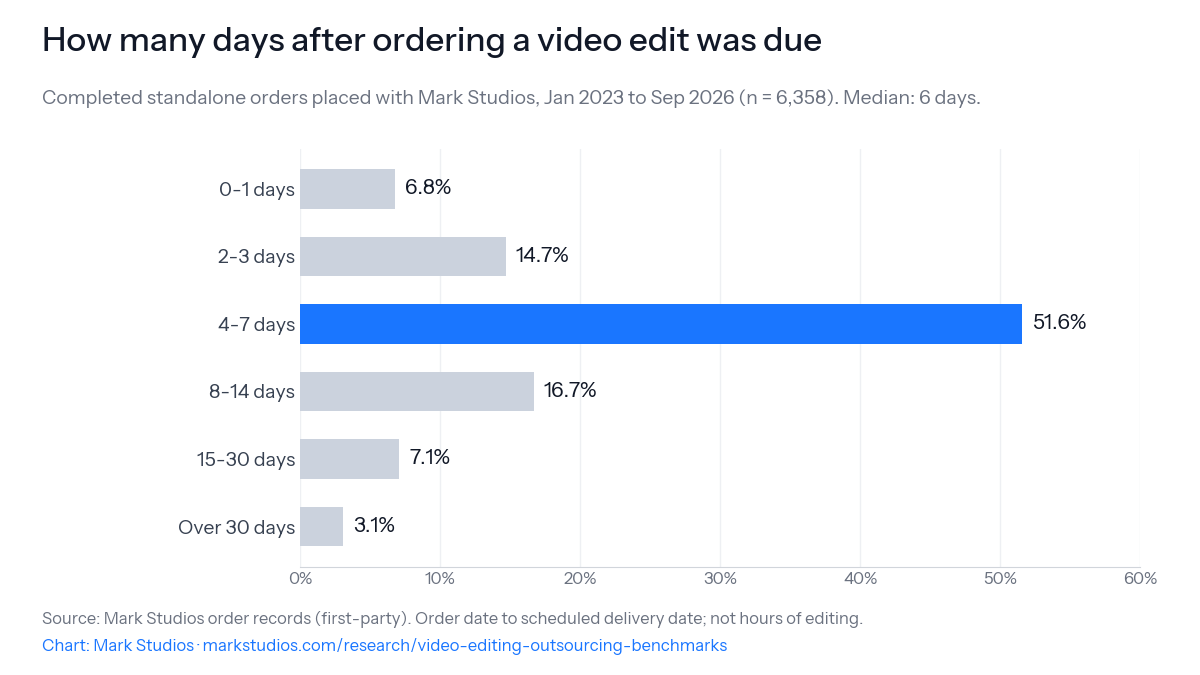
How many days after ordering a video edit was due, 6,358 orders
How many days after ordering each edit was dueCompleted standalone orders placed Jan 2023 to Sep 2026, n = 6,358. Median: 6 days.From Video Editing Outsourcing Benchmarks
Use this chart

Download the PNG (1200×675) or paste this code:

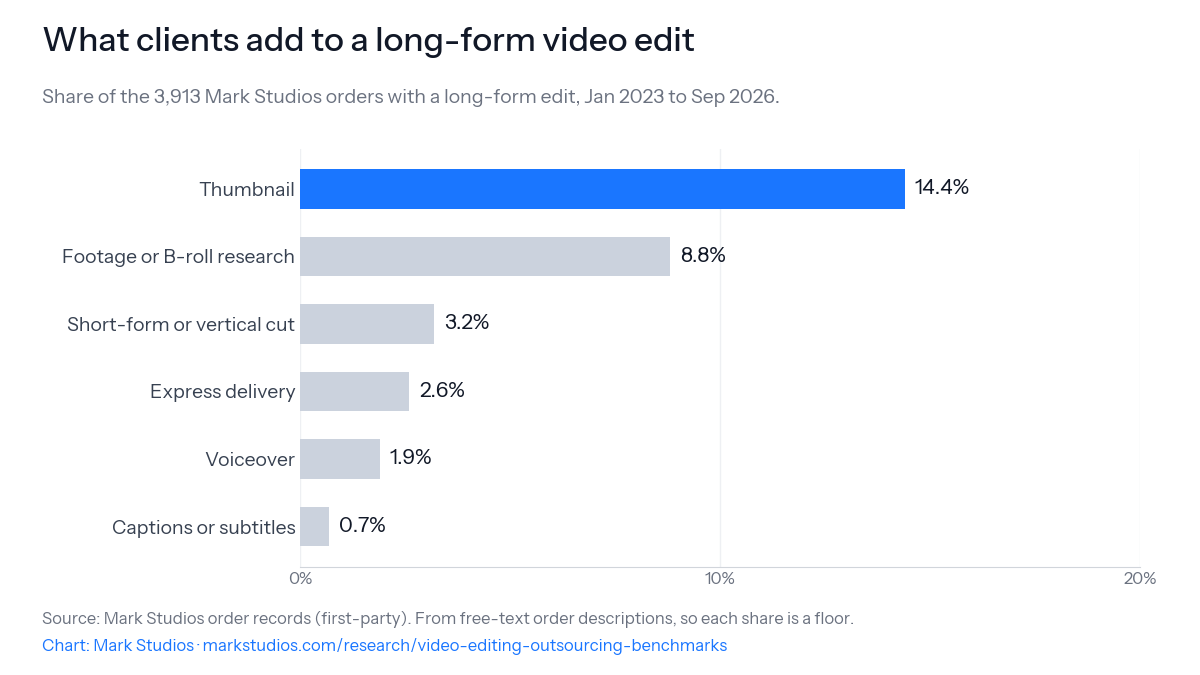
Add-ons included with long-form video edits, 3,913 orders
What clients add to a long-form video editShare of the 3,913 orders with a long-form edit, Jan 2023 to Sep 2026. Captions are a floor: descriptions under-record them.From Video Editing Outsourcing Benchmarks
Use this chart

Download the PNG (1200×675) or paste this code:

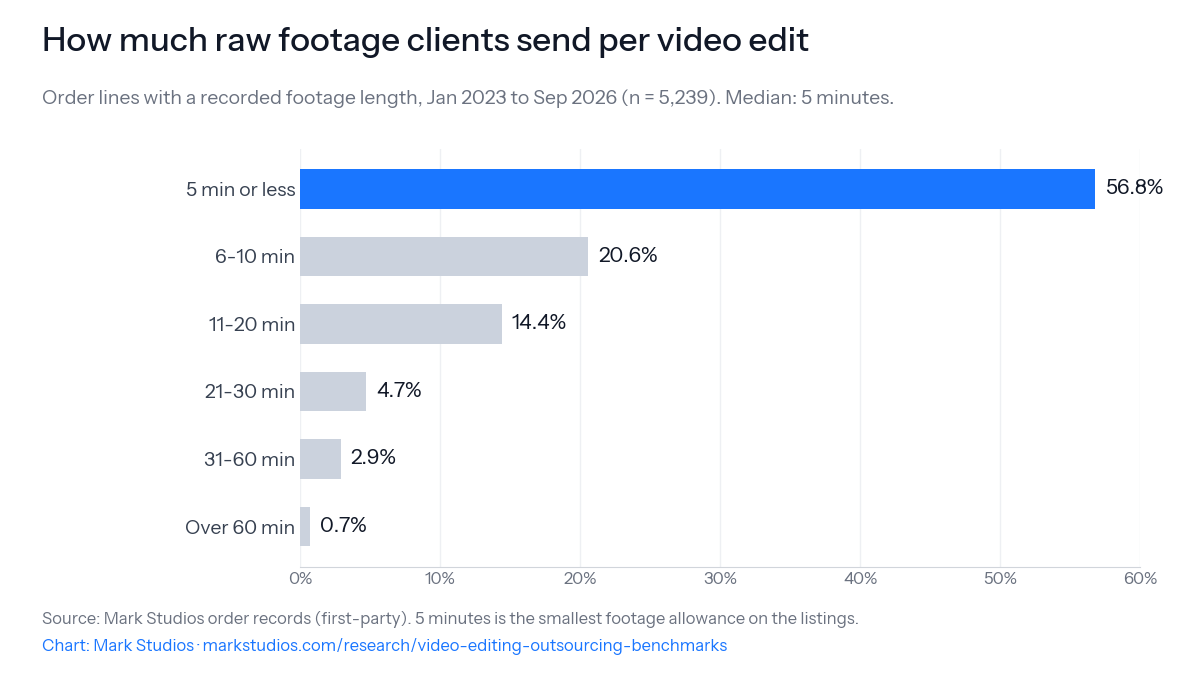
Raw footage per video edit order line, 5,239 lines
Raw footage recorded per order lineOrder lines with a recorded footage length, n = 5,239 (68.5% of lines). Median: 5 minutes.From Video Editing Outsourcing Benchmarks
Use this chart

Download the PNG (1200×675) or paste this code:

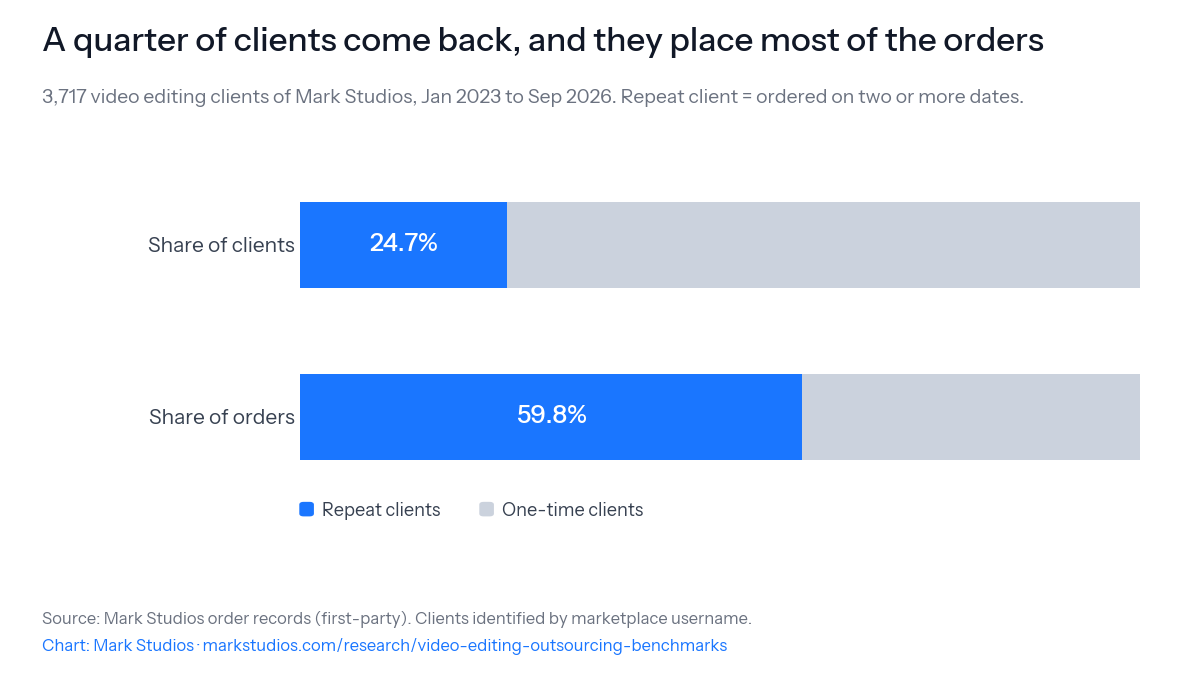
Repeat video editing clients: 24.7% of clients, 59.8% of orders
Repeat clients are a quarter of clients and most of the orders3,717 clients, Jan 2023 to Sep 2026.From Video Editing Outsourcing Benchmarks
Use this chart

Download the PNG (1200×675) or paste this code:

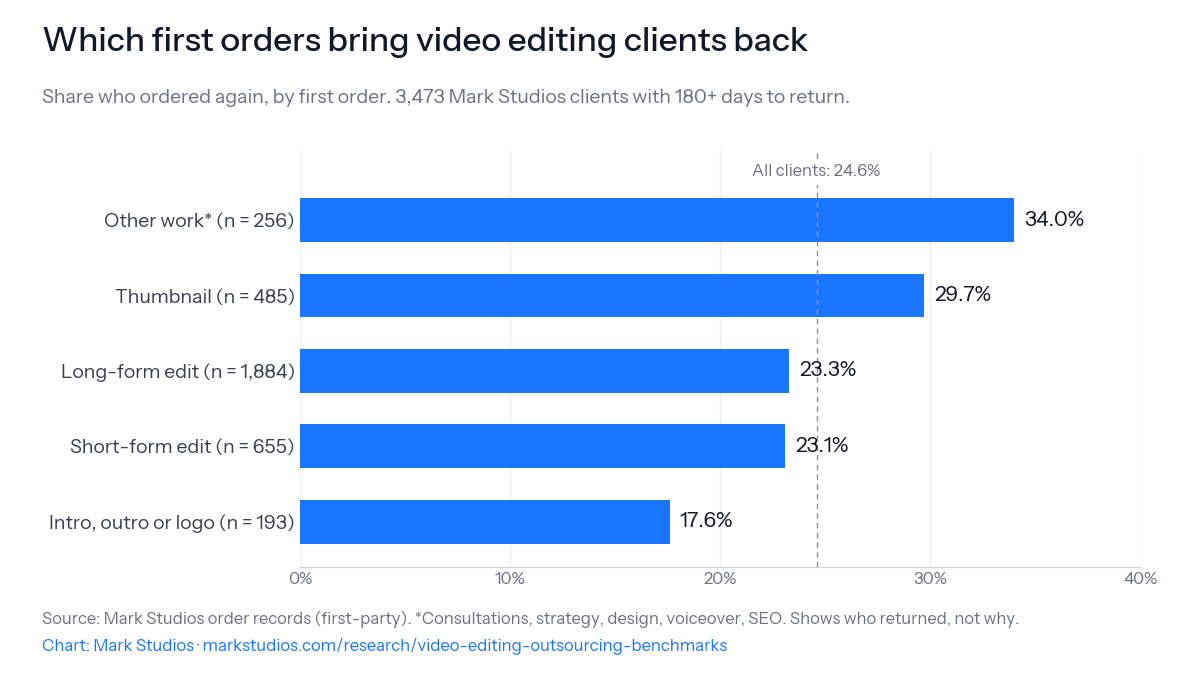
Share of video editing clients who ordered again, by first order
Which first orders bring clients backShare who ordered again on a later date, by the client's first order, among 3,473 clients with 180+ days to return. All of them: 24.6%.From Video Editing Outsourcing Benchmarks
Use this chart

Download the PNG (1200×675) or paste this code:

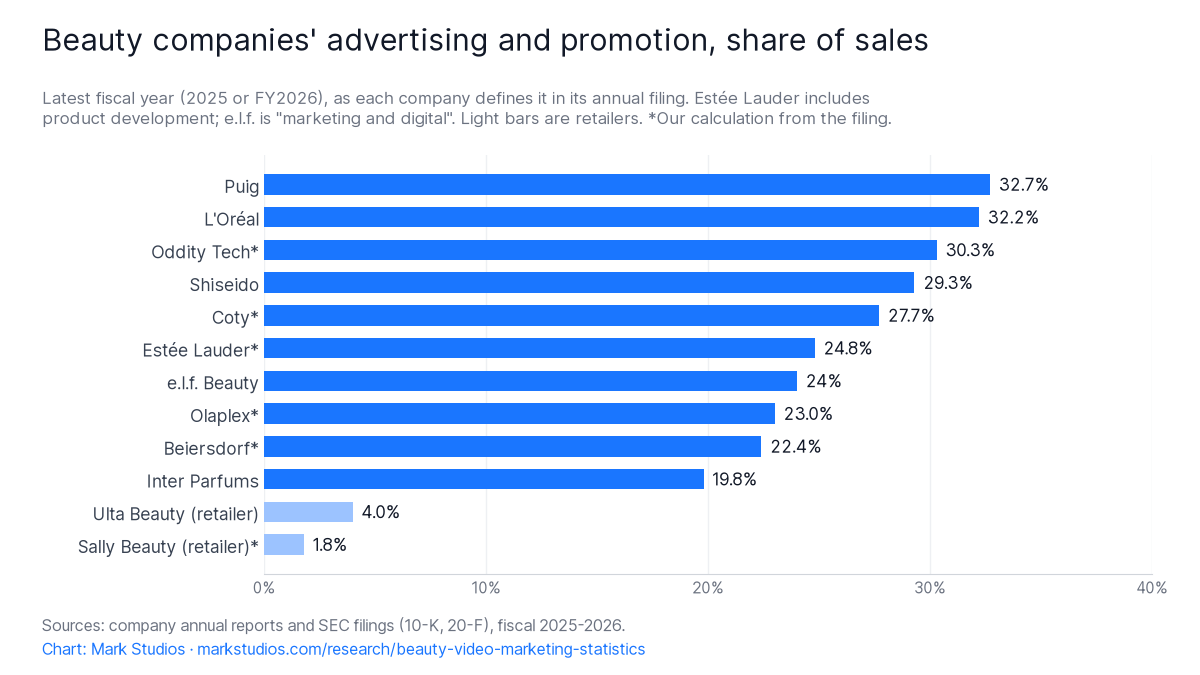
Beauty companies' advertising and promotion as a share of sales, 2025-2026
Beauty companies' advertising and promotion as a share of salesLatest fiscal year (2025 or fiscal 2026), as each company defines it in its annual filing. Estée Lauder includes product development; e.l.f. Beauty's figure is "marketing and digital". Lighter bars are retailers. * Our calculation from the same filing.From Beauty Video Marketing Statistics
Use this chart

Download the PNG (1200×675) or paste this code:

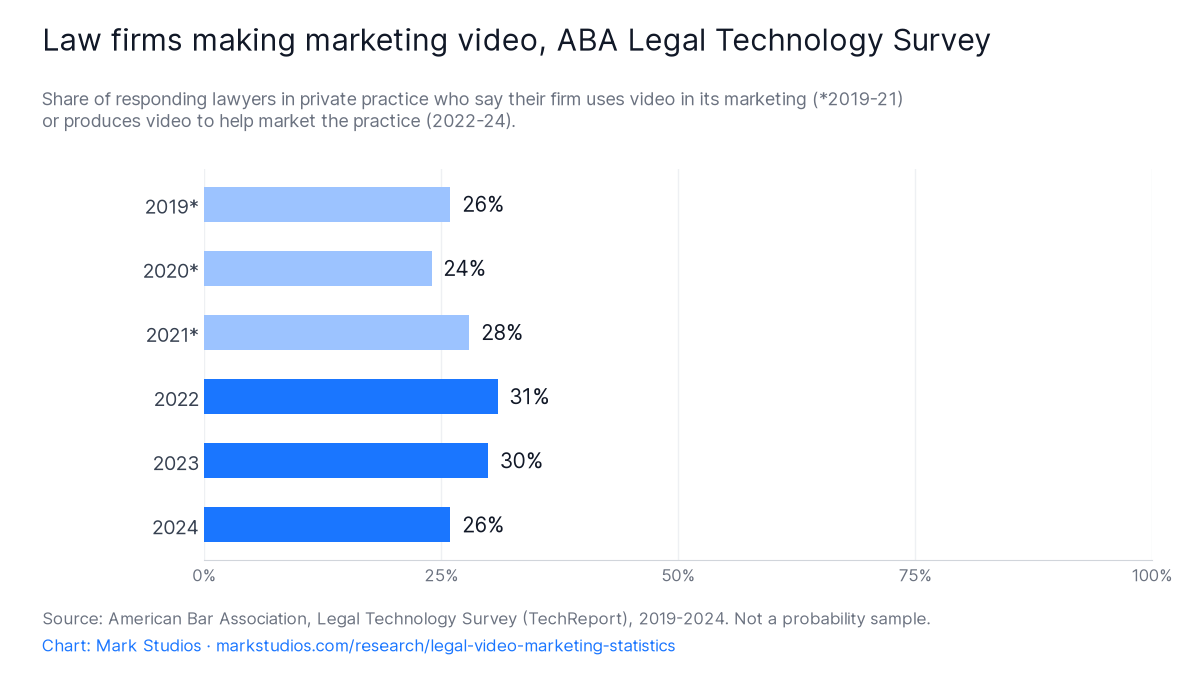
Law firms making marketing video, ABA Legal Technology Survey, 2019 to 2024
Law firms making marketing video, ABA Legal Technology SurveyShare of responding lawyers in private practice. The 2019 to 2021 question (lighter bars, marked *) asked whether the firm uses video in its marketing; from 2022 it asks whether the firm produces video to help market the practice, so the two periods are not strictly comparable.From Legal Video Marketing Statistics
Use this chart

Download the PNG (1200×675) or paste this code:

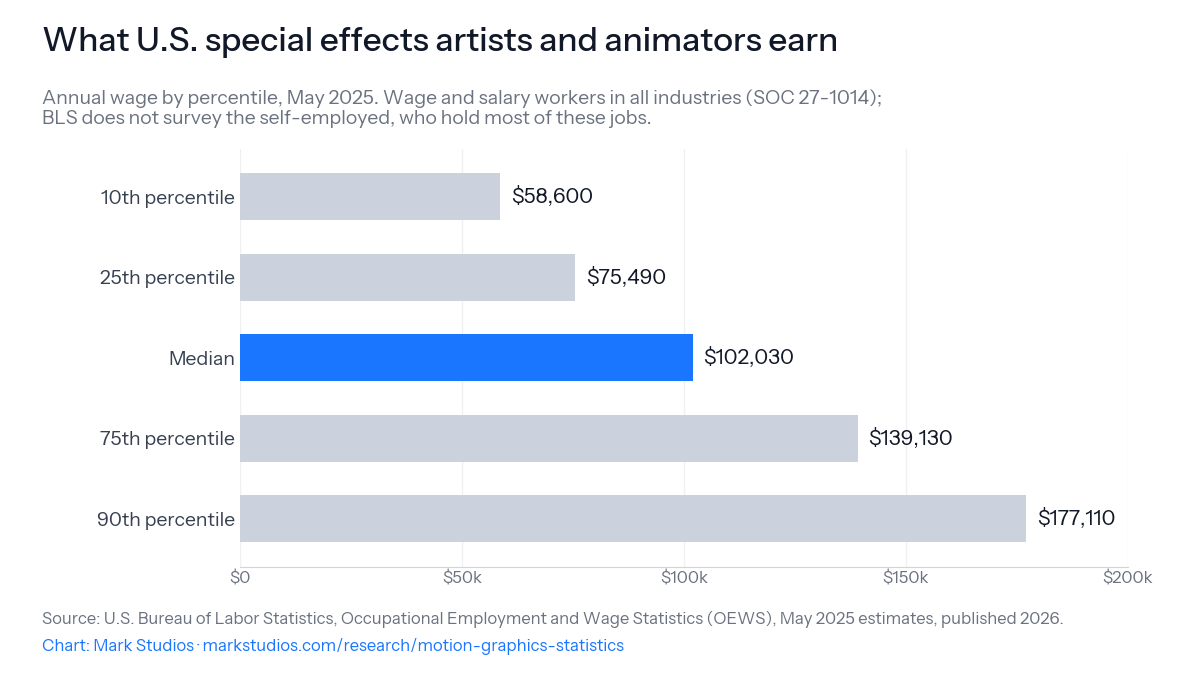
Annual wage of U.S. special effects artists and animators by percentile, May 2025
What U.S. special effects artists and animators earnAnnual wage by percentile, May 2025, from BLS OEWS. Wage and salary workers in all industries (SOC 27-1014); the self-employed, who hold most of these jobs, are not surveyed.From Motion Graphics Statistics
Use this chart

Download the PNG (1200×675) or paste this code:

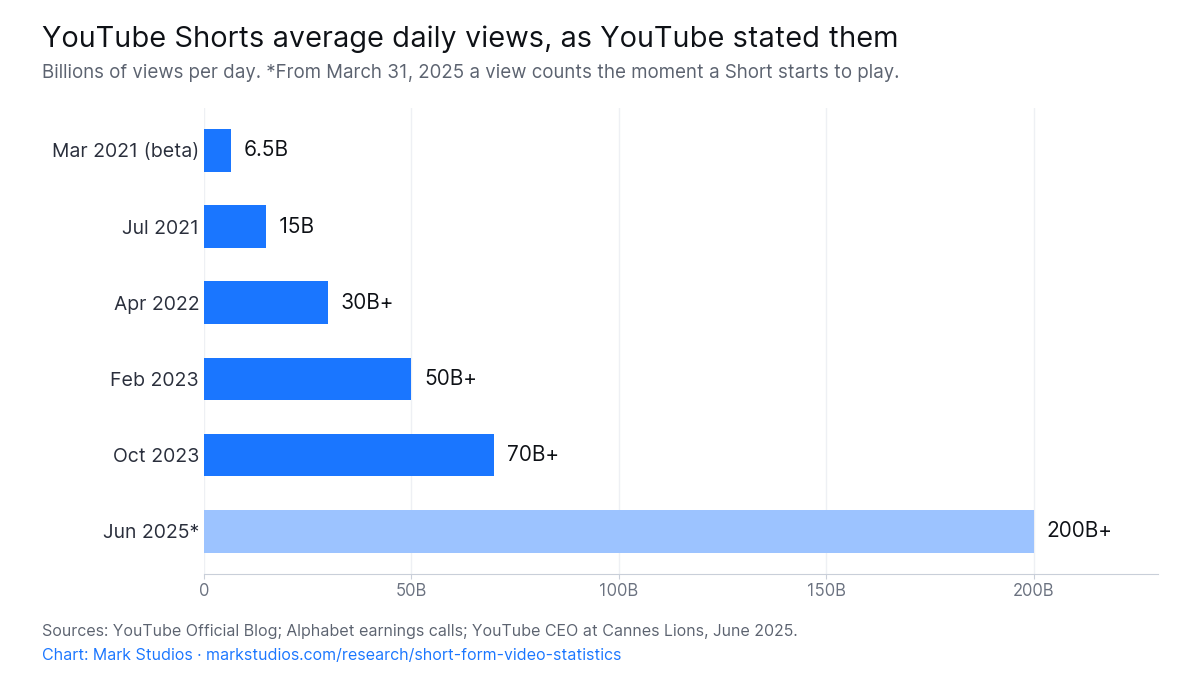
YouTube Shorts average daily views, 2021 to 2025
YouTube Shorts average daily views, as YouTube stated themBillions of views per day. The June 2025 figure (lighter bar) counts a view the moment a Short starts to play, the method YouTube adopted on March 31, 2025, so it is not directly comparable with the earlier five.From Short-Form Video Statistics
Use this chart

Download the PNG (1200×675) or paste this code:

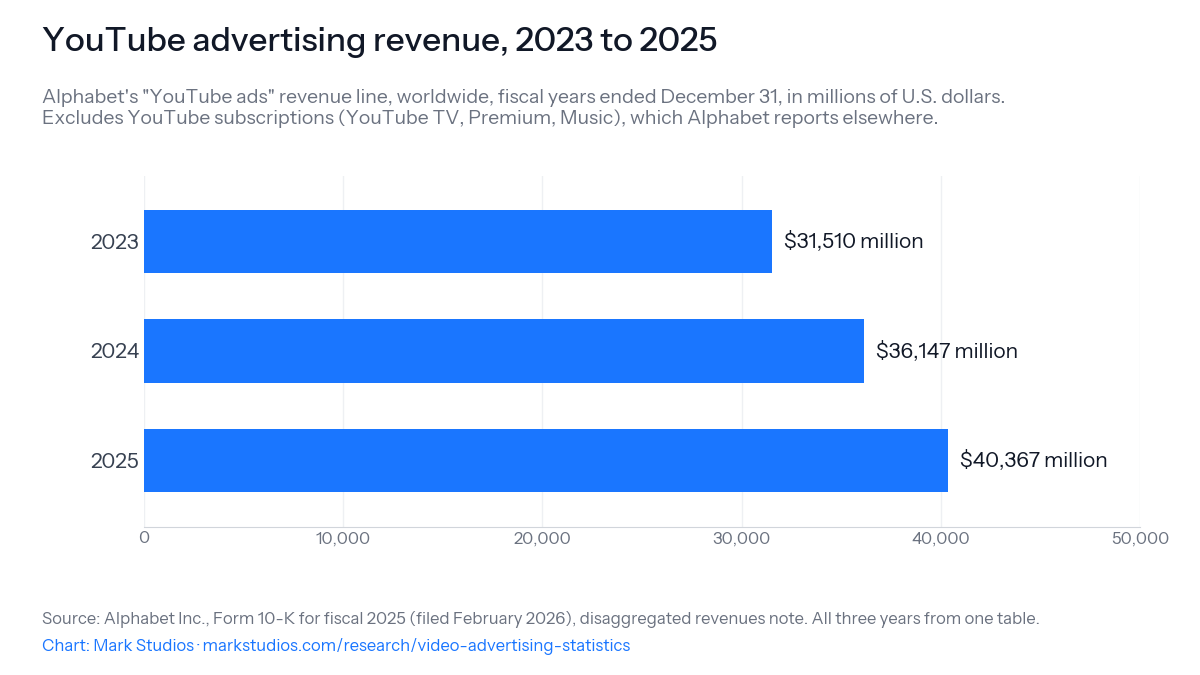
YouTube advertising revenue reported by Alphabet, 2023 to 2025
YouTube advertising revenue, 2023 to 2025, as Alphabet reported itMillions of U.S. dollars, worldwide, fiscal years ended December 31. Alphabet's "YouTube ads" line excludes YouTube subscriptions, and all three years come from one table in the same Form 10-K, so they are directly comparable.From Video Advertising Statistics
Use this chart

Download the PNG (1200×675) or paste this code:

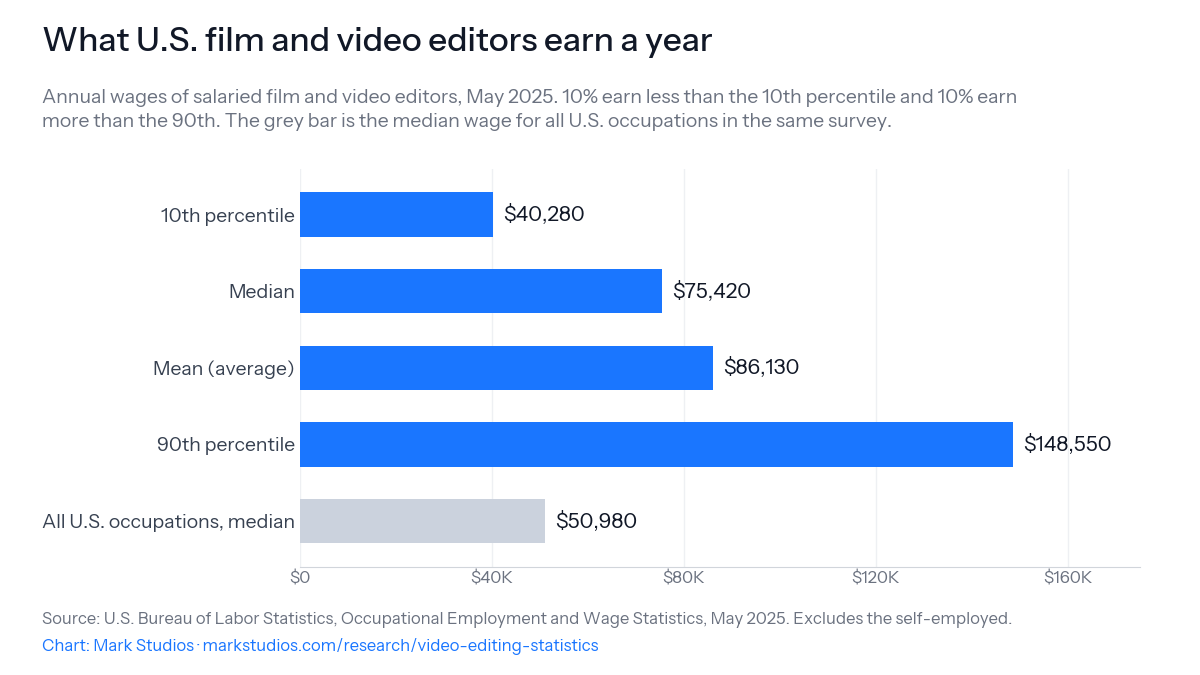
Annual wages of U.S. film and video editors, May 2025
What U.S. film and video editors earn a yearAnnual wages of salaried film and video editors in May 2025, from the Bureau of Labor Statistics. 10% earn less than the 10th percentile and 10% earn more than the 90th. The grey bar is the median for all U.S. occupations in the same survey.From Video Editing Statistics
Use this chart

Download the PNG (1200×675) or paste this code:

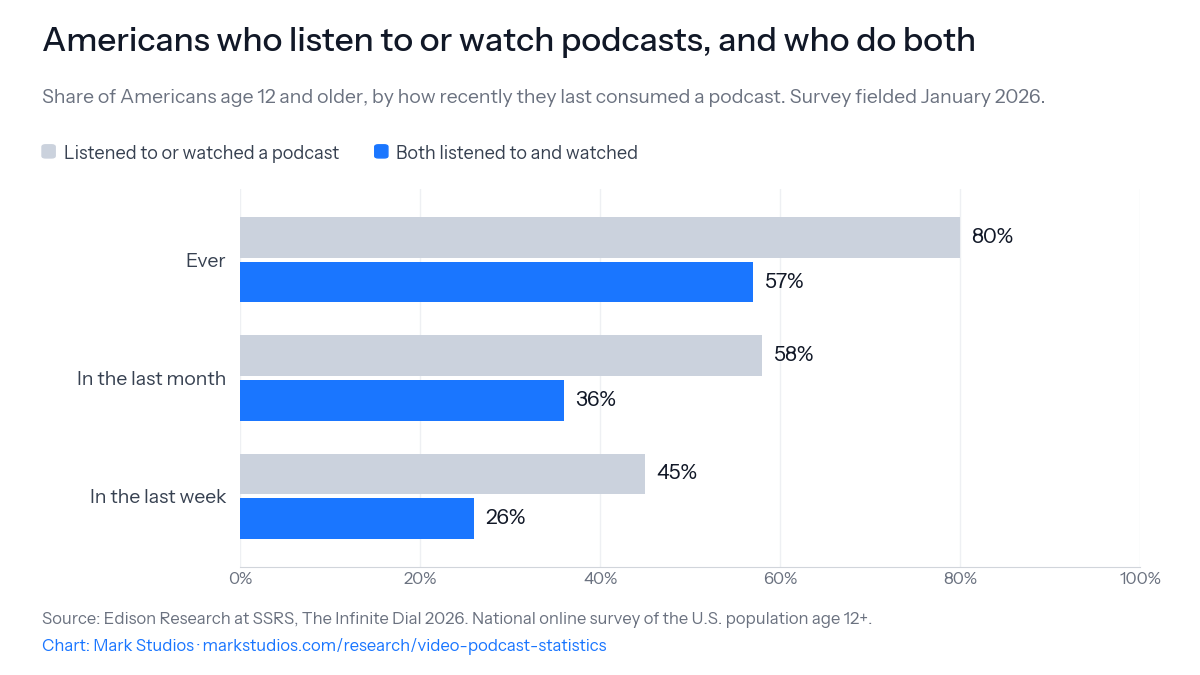
Share of Americans 12+ who listen to or watch podcasts, and who do both, The Infinite Dial 2026
Americans who listen to or watch podcasts, and who do bothShare of Americans age 12 and older, by how recently they last consumed a podcast, from The Infinite Dial 2026 by Edison Research at SSRS (surveyed January 2026). People who both listened and watched are part of everyone who listened or watched.From Video Podcast Statistics
Use this chart

Download the PNG (1200×675) or paste this code:

How to use these charts

  • They are free to reuse under Creative Commons Attribution 4.0, commercially or not, with no need to ask.
  • Credit Mark Studios with a link to the page the chart comes from. The embed code under each chart already includes it: "Chart: Mark Studios" linking to that page.
  • The underlying numbers belong to their publishers. Each chart names its source. If you quote a figure in your text, cite that publisher as well; the research page links to the original.
  • Charts based on Mark Studios order data are our own first-party research; the method and limits are on the benchmarks page.

Spotted an error, or need a chart in another size? Write to contact@markstudios.com. If you need the video work itself rather than the numbers, see video editing at Mark Studios.