Every figure on this page links to the organization that produced it, and each was re-checked against that source before publishing. What the biggest software companies' homepages and demo buttons actually offer (our own measurement), how B2B buyers research software before they talk to sales, what demo vendors report about interactive and live demos, how much video influences a software purchase, what happens after the sale, and where the popular product demo numbers came from.
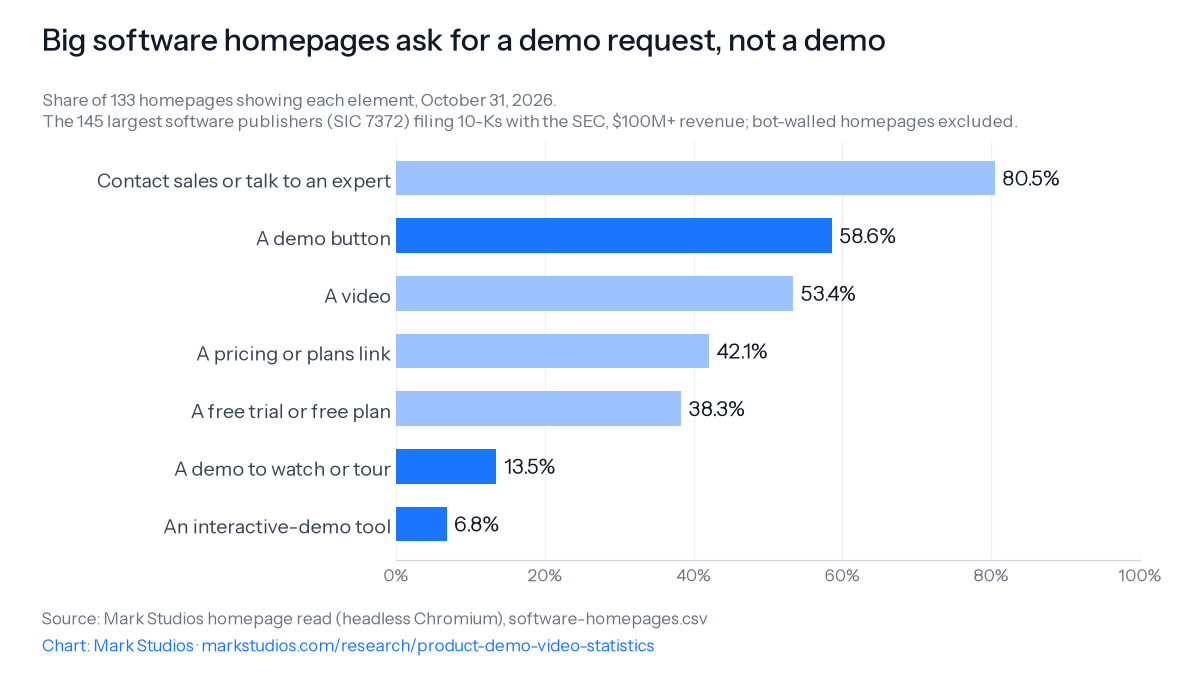
58.6% of the largest SEC-reporting software publishers' homepages carried a demo button on October 31, 2026; 56.4% asked visitors to request a demo, and only 13.5% offered one to watch or tour. (Our measurement)See details
Of the demo buttons we followed, 76.7% opened a contact form and 64.4% opened a form with nothing to watch; only 5.5% let a visitor watch a demo without filling anything in. (Our measurement)See details
53.4% of those homepages showed a video, but 24.8% were muted background loops, and only 14.3% embedded a player a visitor could click. (Our measurement)See details
Of the 6,964 videos these companies' YouTube channels posted in the year to October 31, 2026, only 1.8% had demo in the title; 43.4% of the active channels posted any. (Our measurement)See details
67% of B2B buyers in Gartner's 2025 survey preferred a rep-free buying experience, up from 61% in 2024. (Gartner)See details
62% of software buyers name the product trial as their top factor in the final purchase decision, and more than 60% of business buyers use a trial to evaluate. (Gartner Digital Markets; Forrester)See details
54% of technology buyers used a product demo in TrustRadius' 2024 survey; in 2023, 38% said having to contact sales for a demo or trial made them less likely to buy. (TrustRadius)See details
Interactive demo completion has no common definition: 26% on average in Storylane's sample, a 58% median among people who start an Arcade demo, and 48% for the top tier of Navattic demos. (Storylane; Arcade; Navattic)See details
The "73% prefer to learn about a product by video" figure is Wyzowl's 2022 consumer answer; its 2026 edition says 63%. (Wyzowl)See details
"Interactive demos convert 7.9x better" compares demo viewers with the average of all sessions in one vendor's 2024 dataset, not with people who saw no demo. (Storylane and Factors.ai)See details
What do the biggest software companies put on their homepages?
A demo button, and usually one that leads to a sales form. On October 31, 2026 we read the homepages of the 145 largest software publishers that file 10-K reports with the SEC (SIC code 7372, at least $100 million in annual revenue); 133 loaded for a headless browser. 58.6% carried a call to action with the word "demo" on it, and 39.1% showed one in the first screen of a desktop window. Nearly all of those buttons ask for a demo: 56.4% of homepages had a demo-request button, while 13.5% offered a demo to watch, tour or try, and 6.8% loaded an interactive-demo vendor's code (Navattic, Storylane or Guideflow). A free trial or free plan appeared on 38.3%, a pricing or plans link on 42.1%, and a contact-sales or talk-to-an-expert button on 80.5%.
Big software homepages ask for a demo request, not a demoShare of 133 homepages showing each element, October 31, 2026. The 145 largest software publishers (SIC 7372) filing 10-Ks with the SEC, $100M+ revenue; bot-walled homepages excluded.
The homepages split into four groups. 35.3% offered a demo but no free trial or free plan, the classic sales-led pattern; 15.0% offered a free start but no demo button; 23.3% offered both; and 26.3% offered neither, a mix of corporate homepages (Microsoft, Block, Take-Two), consumer apps and games, and developer tools whose button just says "Get started". Video is common but mostly decorative: 53.4% of homepages showed a video and 36.8% showed one in the first screen, but 24.8% played a muted background loop with no controls, while only 14.3% embedded a player a visitor could click. 67.7% linked to YouTube.
Our count of the largest SEC-reporting software publishers next to Navattic's scan of about 5,000 B2B SaaS websites
Call to action
Largest SEC-reporting software publishers, October 2026 (our count, 133 homepages)
About 5,000 B2B SaaS websites (Navattic, 2026 report)
The two counts measure different things (our label rules on the biggest public companies against Navattic's button categories on a random sample of smaller SaaS sites), but they agree that the demo request is the default and the self-serve demo the exception.
Where does the demo button go?
To a form, three times in four. We followed the first linked demo button on each homepage (74 of the 78 had one; a visible one near the top first) and read the page it opened. Of the 73 pages we could read, 76.7% opened a page with a form asking for contact details, and 64.4% opened a form with nothing to watch on the page. Only 5.5% let a visitor watch a video or click through an interactive demo without filling anything in, and 17.8% had a video or interactive demo on the page at all, form or not; the rest were mostly demo libraries, resource centers and event pages, plus a few forms our check could not detect. A demo, on these sites, mostly means a meeting.
What the page behind the demo button showed, 73 demo buttons on the largest SEC-reporting software publishers' homepages, October 31, 2026
That is the gap the buyer surveys describe. In TrustRadius' 2023 survey, 38% of technology buyers said having to contact sales to get a demo or free trial would make them less likely to buy, and Gartner's buyers increasingly prefer to buy without a rep (see below).
What do these companies post on YouTube?
Very few demos. 57.9% of the readable homepages linked to a YouTube channel we could resolve. Those channels uploaded 6,964 videos between November 1, 2025 and October 31, 2026 (the median channel posted 67), and only 1.8% had "demo" in the title. 43.4% of the active channels posted at least one demo-titled video in the year, and one channel, Workiva's, posted 12.6% of them. The median demo-titled long-form video ran 3.7 minutes, against 4.5 minutes for the channels' other long-form videos, and Shorts were 33.4% of all uploads.
How we counted: the frame is every company the SEC lists under SIC 7372 (prepackaged software) with an annual U.S. GAAP revenue figure of at least $100 million for 2024 or 2025 in the SEC's XBRL frames, whose latest annual report is a 10-K (20-F and 40-F filers, most of them foreign private issuers, are left out). The website is the one each company names in its 10-K, or its Wikidata entry. Homepages were read in headless Chromium at desktop size with an English locale; 12 answered with a bot wall or an error and are left out of every percentage rather than worked around. A call to action counts when a link or button label of 60 characters or less contains the word; "above the fold" means the top edge sits within 900 pixels. Video rules follow our homepage video study. The per-company data is in software-homepages.csv and the YouTube uploads in youtube-uploads.csv; the scripts are described in the evidence folder.
How do B2B buyers research software before they talk to sales?
Mostly on their own, and they often have a favorite before the first call. In Gartner's survey of 646 B2B buyers in August and September 2025, 67% said they prefer a rep-free buying experience, up from 61% of 632 buyers a year earlier (a rise of 6 points, our calculation), and 70% said they prefer a completely digital, self-service purchase (Gartner, Gartner, Gartner). An undated Gartner page puts the rep-free share at 75% without naming its survey (Gartner); the dated surveys are the better figures to cite. Gartner's older journey research, published around 2019, found buyers spend only 17% of their buying time meeting potential suppliers, and 5% or 6% with any one rep when comparing several (Gartner, Gartner).
Going it alone has costs. In 2024, 69% of the buyers Gartner surveyed found the seller's website and its salespeople told them different things (Gartner). Gartner's 2021 research found purchase regret 23% higher among customers who preferred a rep-free experience (Gartner), yet in its survey of 725 buyers that year, 65% of those who navigated the purchase themselves completed a high-quality deal, against 24% in mainly rep-led purchases (Gartner). Regret is common either way: 59% of 3,500 software buyers in Gartner Digital Markets' 2025 survey regretted at least one software purchase from the past 18 months, after 60% in its 2024 survey (Gartner Digital Markets, Gartner Digital Markets), and in Capterra's 2026 report 66% of 3,385 software decision makers hit an unexpected disruption, regret or both (Capterra); 89% of those with regret had first run into an implementation problem (Capterra). Forrester's 2024 research found 86% of B2B purchases stall at some point and 81% of buyers were dissatisfied with the provider they chose (Forrester, Forrester).
How far through the journey are buyers when they first contact a vendor?
Between about 60% and 70% of the way, in 6sense's annual survey of B2B buyers. 6sense sells account-based marketing software:
When B2B buyers first engage sellers, 6sense Buyer Experience Reports
84% said the first vendor contacted won the business; buyers considered four vendors on average (6sense, 6sense)
2024
Nearly 70% through; buyers initiated first contact more than 80% of the time (6sense)
81% had a preferred vendor at first contact; the average cycle lasted 11.3 months (6sense, 6sense)
2025 (4,000+ buyers)
The research-to-seller split moved from 70/30 to 60/40 (6sense)
94% of buying groups had ranked vendors before first contact; cycles shortened to 10 months; the early favorite won 77% of the time in the key findings and 80% in the same release's opening (6sense, 6sense, 6sense, 6sense)
TrustRadius, which sells buyer-intent data to software vendors, found the same pattern from the shortlist side. In its March 2024 survey of 2,164 technology buyers, 78% shortlisted products they had heard of before starting research, 71% bought their first choice, and 87% finished within a six-month sales cycle (TrustRadius, TrustRadius, TrustRadius). In 2026, 83% of 1,862 buyers shortlisted three products or fewer (TrustRadius). Gartner Digital Markets found software buyers actively engage only 2.5 vendors on average, that 83% changed their initial vendor list after research, and in its earlier survey that 89% of buyers who start with a list buy from it (Gartner Digital Markets, Gartner Digital Markets, Gartner Digital Markets). G2's April 2025 survey of 1,169 decision makers found nearly two out of three prefer to meet vendor salespeople only in the later stages (G2).
How many people are in a software buying group?
Anywhere from 3 to 14, depending on who asks and how. The spread is wide enough that a single number misleads:
14 when the purchase includes generative AI features, against seven without
Same survey
That is why a demo that can be forwarded matters: the demo vendors' own data in the section on who watches shows forwarded colleagues watching sooner than the person the demo was sent to.
Which sources do software buyers use and trust?
Demos rank near the top for the buyers who use them. In TrustRadius' 2024 survey, 54% of technology buyers used at least one type of product demo (67% for enterprise purchases), and 71% of those called demos the most influential resource they consulted (TrustRadius). Forrester's 2026 research found more than 60% of business buyers use a trial to evaluate solutions, 78% for purchases of $10 million or more (Forrester). Gated access puts some off: in TrustRadius' 2023 survey, 38% said having to contact sales to get a demo or free trial would make them less likely to buy, and 100% wanted to self-serve all or part of the journey (TrustRadius, TrustRadius). Only 15% of those buyers consulted vendor-driven marketing materials when deciding (TrustRadius).
Peers and reviews matter more. Reading reviews is important to 98% of software buyers in Gartner Digital Markets' 2024 survey of more than 2,400 decision makers (Gartner Digital Markets); TrustRadius found 77% check user reviews in 2025 and 74% use reviews to inform the decision in 2026 (TrustRadius, TrustRadius), and 56% of 2024's buyers and 54% of 2025's talked with a current user before buying, more than vendors guessed (TrustRadius, TrustRadius). Analyst reports have faded: 14% of buyers used them in 2025 and 13% in 2026 (TrustRadius, TrustRadius). Buyers in Gartner's 2025 survey used an average of seven information sources, and McKinsey's 2024 B2B Pulse Survey of nearly 4,000 decision makers counted an average of ten ways of interacting with suppliers, with roughly one-third wanting in-person, remote and self-serve contact at every stage (Gartner, McKinsey & Company, McKinsey & Company).
AI is now one of those sources. 45% of Gartner's 2025 buyers used AI during a recent purchase (Gartner), 63% of TrustRadius' 2026 buyers did (TrustRadius), and Forrester puts it at 94% of business buyers (Forrester). In G2's March 2026 survey, 51% of 1,076 software buyers start research with an AI chatbot more often than with Google, and 69% chose a different vendor than planned because a chatbot recommended it (G2, G2).
Do software buyers want a demo, a free trial or an interactive tour?
Most B2B software sites still ask visitors to book a demo with sales, both in our count of the largest SEC-reporting software publishers and in demo vendors' scans. In Navattic's 2026 scan of a fixed sample of about 5,000 B2B SaaS websites, 61% carried a "Book a Demo" call to action, against 22% with "Try for Free". Interactive demo buttons are growing from a small base: 18% of the same sites had one in the 2026 scan, up from 12% in 2024 (Navattic). Navattic's 2024 report counted a single button label: 9.26% used some version of a "Product Tour" button (Navattic). Navattic sells interactive demo software, so it has a stake in the trend it measures.
Buyers say the trial matters more than the pitch. In Gartner Digital Markets' 2025 survey of 3,500 software buyers worldwide, 62% named the product trial as their top factor in the final purchase decision (Gartner). What happens after a free signup depends on the model. In OpenView's 2022 benchmarks of 450-plus SaaS companies, free-trial companies converted 17% of trial signups to paying customers, while freemium companies converted 5% of free signups (OpenView). Both figures come from a worked example built on survey medians, not from one company's funnel.
How many people finish an interactive demo?
There is no single completion rate, because each vendor defines "completion" against a different starting group. Navattic divides by every unique visitor, Arcade by people who start the demo, HowdyGo and Storylane by engaged viewers, and Supademo reports only its best demos. The table puts the published figures side by side. Every source is a demo-software vendor reporting on demos built with its own product.
Vendor and data
What counts as a start
Completion rate
Navattic, 2026 report, 40,000+ demos built in 2025
Every unique visitor
Top 1%: 48%; top 10%: 40%; top 25%: 43% (tiers ranked by click-through, so the top 25% can beat the top 10%) (Navattic, Navattic)
Navattic, 2025 report, 28,000+ demos built in 2024
Every unique visitor
Top 1%: 61.6%; top 10%: 43.5%; top 25%: 28.9% (Navattic, Navattic)
Navattic's own top-tier rate fell from 61.6% to 48% between its 2025 and 2026 reports after it changed how it ranks demos, so the two editions do not show a real decline. The scale behind the figures has grown fast: Navattic's reports drew on more than 18,000 demos in 2023, 28,000 in 2024 and 40,000 in 2025 (Navattic, Navattic, Navattic). Arcade's 2026 benchmark covers 14 million demo sessions (Arcade) and Supademo's 150,000+ demos (Supademo). Navattic's top 1% of demos sent 71% of visitors on to an external call to action in its 2026 report, up from 54% a year earlier (Navattic).
How long should an interactive demo be?
Mid-length tours finish best in two vendors' data. Arcade demos with 9 to 12 steps had a 40% completion rate, against 22% for 1 to 5 steps and 32% for 6 to 8 (Arcade). On HowdyGo, 62.8% of engaged viewers finished demos of 6 to 8 steps, against 31.8% for 21 steps or more (HowdyGo). Arcade also found that viewers who get past step 7 are 2.3 times more likely to complete the demo (Arcade), and that image-heavy demos averaged about 45% completion against about 36% for video-heavy ones (Arcade). How-to demos hold attention better than showcase tours: on HowdyGo, instructional demos reached 57.2% completion among engaged viewers and broad product tours 37.3% (HowdyGo, HowdyGo).
Time spent depends on the job the demo does. Navattic reports 6.5 mins on average for sales demos, 2.3 minutes for marketing demos and 19.7 minutes for training demos (Navattic). Demos sent directly to a prospect drew an average view time of 5 minutes and 14 seconds on Consensus, down 5.5% from 2025 (Consensus), and 5 minutes and 5 seconds inside Navattic's automated demo links (Navattic). Consensus says most buyers do not click through more than four steps of a product tour before leaving (Consensus). Supademo's survey of 200-plus users found only 23% use interactive demos at the decision stage, against 63% at onboarding (Supademo).
Who watches a demo after it is sent?
Demos travel inside the buying company. Consensus, which sells demo automation software, identifies an average of four unique stakeholders per demo shared through its platform (Consensus). Colleagues who receive a forwarded demo engage at a 61% rate, against 28% for the person it was sent to, and watch it an average of 88 hours sooner (Consensus, Consensus). Demo boards shared with seven or more stakeholders were tied to sales opportunities 36% of the time, against 19% when nobody else was added (Consensus), and buyers who engaged with nine or more demos closed at over 55% (Consensus). These are associations in the vendor's own data, not proof that the demos caused the deals.
Timing is uneven. On Consensus, 45% of demo views happen within 60 minutes of sending, yet buyers take an average of 5 days to open a demo (Consensus, Consensus): the average is pulled up by the demos opened late. The average view rate for its demo boards is 38% (Consensus).
What does a live sales demo cost the seller?
Live demos are expensive to run. Sales engineers surveyed by Navattic (70-plus presales staff at B2B SaaS companies, December 2025 to January 2026) run an average of 7 demos a week, and a standard demo takes 3.6 hours including preparation, a custom one 7 hours (Navattic, Navattic). They report needing 3 demos on average to close a deal, and 1.6 calls pass before a sales engineer joins (Navattic, Navattic); 94% repeat the same demo at least sometimes (Navattic). The sample is small and drawn from Navattic's audience.
The best-known study of demo calls is older. Gong Labs analyzed 67,149 recorded B2B sales demos before September 2017 (Gong). Demos that led to closed deals lasted 47 minutes on average, against 36 minutes for the rest (Gong); the seller's talk-to-listen ratio on winning demos was 65:35, close to the 66:34 on losing ones (Gong); and no winning demo included more than 76 seconds of uninterrupted pitching (Gong).
How many demo requests turn into meetings?
About six in ten qualified demo requests become a booked meeting in two scheduling vendors' data. Across more than a million inbound form submissions, the median B2B SaaS company using RevenueHero booked meetings with 62% of qualified demo-form leads, and the top 10% booked 78% or more (RevenueHero, RevenueHero). Chili Piper reports 66.7% of qualified demo form submissions on its customers' sites booked a meeting in 2024, and that 14.1% of people who filled out a demo form were not qualified (Chili Piper, Chili Piper). Chili Piper compares its figure with a "30% industry average" it does not source, and says only 8% of top B2B SaaS companies let visitors schedule a meeting straight from the form, without stating its sample (Chili Piper). Both vendors sell meeting-scheduling software, and their customers are companies that already bought a tool to book faster.
Demo vendors also publish win-rate claims. In Navattic customers' 2025 CRM data, deals where an automated demo went out within 14 days of the deal being created had a 72% win rate, against 59% for deals with no demo touch, and demo deals closed 19 days faster (Navattic, Navattic); Navattic does not say how many deals the comparison covers. Navattic users it surveyed about their 2024 demos estimated their win rates rose about 20% to 30% (Navattic). Comparisons with video are weaker still: Navattic says interactive demos convert 12% better than product videos by setting its own click-through rate beside Wistia's figures (Navattic), and Arcade says the average product tour gets 7.2x the click-through of an unnamed "industry average" for product marketing videos (Arcade).
How much does video influence a software purchase?
In the survey most often quoted, a large majority say it has. In Wyzowl's 2026 survey, fielded in late 2025, 80% of consumers said they had bought or downloaded software or an app after watching a video about it, and 85% said a video had convinced them to buy a product or service (Wyzowl, Wyzowl). Wyzowl makes explainer videos for a living, recruits its own online sample each year and asks whether people have ever done these things, so the answers measure exposure, not what decided a purchase. The same question asked of the same kind of sample swings from year to year, which is the best guide to how much weight a single edition can bear.
Wyzowl's consumer answers by edition (each survey fielded in December or late in the year before its title year)
Edition
Have watched an explainer video to learn about a product or service
Would most like to learn about a product by watching a short video
Bought or downloaded software or an app after a video
The middle column is the source of the widely repeated "73% prefer to learn about a product by video" (see the popular numbers): it was Wyzowl's 2022 answer, and the four other editions printed 69%, 44%, 78% and 63%. Wyzowl's 2026 trend data also lists 94% for the 2021 edition's explainer answer and 94% for 2022's, where those editions printed 96% (Wyzowl, Wyzowl); we show both and treat the printed editions as the record. The broader "convinced to buy a product or service" answer was 87% in the 2025 edition and 82% in 2024 (Wyzowl, Wyzowl).
How many marketers make product demo videos?
Fewer than half. Among the video marketers in Wyzowl's 2026 survey, 39% said they make product demo videos and 17% app demo videos, while 68% make explainer videos, second only to social media videos (Wyzowl, Wyzowl, Wyzowl). Earlier editions put product demo videos at 36% (2023), 32% (2024) and 48% (2025) of marketers, and explainers at 73% in 2025 (Wyzowl, Wyzowl, Wyzowl, Wyzowl); the marketer subgroups ranged from 205 to 967 people, so a swing of ten points between editions is within what sampling alone can do. 19% of 2026's marketers said screen-recorded video is the main type they create (Wyzowl).
On length, 71% of Wyzowl's 2026 marketers said videos between 30 seconds and 2 minutes work best (Wyzowl), against 73% in 2025 (Wyzowl); in 2024 the question offered narrower bands and 39% picked 30 to 60 seconds (Wyzowl). Viewers in TechSmith's 2024 study were shorter still: 50% said they prefer videos of 30 seconds or less to learn about a general topic such as a product (TechSmith). 82% of Wyzowl's 2026 marketers said video gave them a good return, down from 93% a year earlier (Wyzowl).
What do video hosts and platforms report?
Video hosts see product pages underperform the homepage. On business websites using Wistia, homepage videos had a 24% play rate in 2025, higher than videos on product, contact or thank-you pages (Wistia). Almost 20% of viewers who saw a lead form inside a Wistia video filled it out (Wistia), and 3-to-5-minute instructional videos averaged 74% engagement in Wistia's 2024 report, against 43% for all videos of that length (Wistia). Wistia-hosted videos drew 2.5 billion plays in 2025 (Wistia). In its 2026 survey of 900-plus professionals at companies that make video, 76% make at least one video a month, 81% share video on LinkedIn and 76% on YouTube, and 47% planned customer testimonial videos for 2026, up from 17% in 2023 (Wistia, Wistia, Wistia). Wistia sells video hosting, and most of its respondents are its own users.
For B2B technology buyers, LinkedIn's 2024 survey of more than 1,700 buyers in the U.S., UK and India found 63% said short-form social video helps inform their buying decisions, and 80% of those who watch video content called video-focused influencer content one of the most trusted forms of B2B content (LinkedIn, LinkedIn). LinkedIn reported video uploads up 34% year over year in October 2024 (LinkedIn). Demand Gen Report's 2024 Content Preferences survey found 67% of B2B buyers named short-form content among the most valuable formats in their decision, and 65% webinars and digital events, up from 52% for webinars in 2023 (Demand Gen Report, Demand Gen Report, Demand Gen Report); its open summary gives no sample size.
Google's own figures are older. In a 2018 Google/Ipsos survey of 2,401 U.S. online adults who had bought something in the past year, over 50% said online video helped them decide which brand or product to buy (Google), and Google reported that watch time for YouTube videos about "which product to buy" grew 2X between 2017 and 2018 (Google). Neither is specific to software.
What happens after the sale: do customers learn the product?
Most of what a software product can do goes unused. Pendo's 2019 Feature Adoption Report, built from three months of anonymised usage in 615 Pendo subscriptions, found 80 percent of features in the average product are rarely or never used, and an average of 12% of features generated 80% of daily usage (Pendo, Pendo). Pendo extrapolated from 2018 revenue that public cloud software companies had spent up to $29.5 billion building those features (Pendo). Its newer benchmarks, across 6,800-plus applications, put the best-in-class (90th percentile) feature adoption rate at 15.6% of features producing 80% of clicks, best-in-class retention at 57% of new users still active three months on, and best-in-class in-app guide engagement at 60.2% (Pendo, Pendo, Pendo). The 2019 and 2024 measures use different bases (daily usage against click volume), so they are not a trend. Pendo sells product analytics and in-app guides; its 2019 report also says customers saw a 50% rise in daily feature use after a year on Pendo, unused features fell by nearly 25%, and customers who deployed at least 25 in-app guides could raise daily features used by 25% (Pendo, Pendo, Pendo). That 25% is about in-app guides, not video.
How do people prefer to learn software?
By video, when asked. In TechSmith's 2024 Video Viewer Study (about 1,000 working adults in six countries; the report's method section gives 929), 83% said video is their preferred way to take in instructional and informational content, and 87% preferred a real person to an animated character or AI avatar (TechSmith, TechSmith); 75% were receptive to instructional videos made with the help of AI (TechSmith). The 2021 edition (914 respondents) found the same 83% preference, 91% watching instructional or informational video at least monthly and 71 percent at least weekly for work (TechSmith, TechSmith, TechSmith). Informal training videos were the type used most (56 percent), and acquiring a new skill for work the most common reason to look one up (25 percent) (TechSmith, TechSmith). In TechSmith's 2018 survey of 924 people, 55% watched two or more technical videos a week, up from 45% in 2016 and 28% in 2013 (TechSmith). TechSmith sells Camtasia and Snagit, screen-recording and video tools.
The only independent survey on this is Pew Research Center's from 2018: 51% of U.S. YouTube users said the site is very important for figuring out how to do things they haven't done before, and 87% called it at least somewhat important (Pew Research Center, Pew Research Center). Those who said very important were 35% of all U.S. adults; the share was 53% among users aged 18 to 29, 41% among those 65 and older and 56% among people who visit several times a day (Pew, Pew, Pew, Pew).
Do customers solve problems on their own?
Rarely all the way. Gartner's survey of 5,728 customers in December 2023 found 73% use self-service at some point in a service journey, but only 14% of issues are fully resolved there, and only 36% even of issues customers call very simple (Gartner, Gartner, Gartner). The most common reason self-service failed, in 43% of cases, was that customers could not find content relevant to their issue (Gartner). In 2019, Gartner's survey of 8,398 customers had put full self-service resolution at 9% and phone as the top preferred channel at 44% (Gartner, Gartner); the two surveys define resolution differently.
Help now often starts off the company's own site. Gartner's January to February 2025 survey of 5,801 customers found 51% of service journeys begin on third-party platforms such as Google, YouTube and ChatGPT, 74% among Gen Z, with an average 62% success rate there; only 22% of customers start, stay and resolve entirely in the company's own channels (Gartner, Gartner, Gartner, Gartner). Zendesk's CX Trends 2026 survey found 79% of 5,115 CX leaders say customers now expect the option to use video or visual sharing in support, and 76% of 6,182 consumers would choose a company that lets them send text, images and video in one support thread (Zendesk, Zendesk). In older Zendesk Benchmark data from 500 help centers, the top five articles drew roughly 40% of daily views, and tickets that linked a help article were resolved 23% faster (Zendesk, Zendesk).
What do companies report from customer education?
Programs report gains, measured by the people who run them. In a Forrester survey of 300 customer education decision makers commissioned by Intellum (early 2024), 96% said their program at least broke even and 86% reported a positive return; the average program saw a 38.3% rise in adoption of the products it trained on, 15.5% lower support costs for trainees and 35% higher lifetime value per trainee, all as respondents reported them (Intellum, Intellum, Intellum, Intellum, Intellum). Gainsight says admins certified through its own training have twice the NPS of those who are not, accounts with trained admins have 51% higher expansion revenue, and 3x higher active-user health scores (Gainsight, Gainsight, Gainsight); customers who choose training may already be the engaged ones. Absorb Software's 2026 benchmark of about 500 programs found 51% called themselves mature, but only 19% passed its maturity test, and 29% reported significant change from AI so far (Absorb Software, Absorb Software, Absorb Software).
Inside companies, the problem is the same. WalkMe's State of Digital Adoption 2026 found workers lose the equivalent of 51 working days a year to technology friction, up from 36 in its 2025 report (WalkMe, WalkMe); 54% of workers had bypassed AI tools to finish a task by hand in the past 30 days, and only 21% of workers agreed they have adequate tools, against 88% of executives (WalkMe, WalkMe). Its 2025 report found executives believed their organizations used 37 applications on average, while its platform data showed 625 (WalkMe), and only 28% of employees felt adequately trained on AI (WalkMe). WalkMe sells digital adoption software.
How big is the software industry that makes these demos?
U.S. software publishers took in about half a trillion dollars a year. The Census Bureau's 2022 Economic Census counted $492,929,994 thousand (about $492.9 billion) in receipts at 20,976 software publisher establishments with paid employees (U.S. Census Bureau, U.S. Census Bureau), and its Annual Integrated Economic Survey put 2024 revenue of software publisher firms at $567,772,378 thousand (about $567.8 billion), up 8.0% on 2023 (U.S. Census Bureau, U.S. Census Bureau). Quarterly revenue reached an estimated $176,958 million in the second quarter of 2026, seasonally adjusted, 14.7% more than a year earlier (U.S. Census Bureau, U.S. Census Bureau). Worldwide, Gartner forecasts software spending of $1,464 billion in 2026 and $1,679 billion in 2027, within total IT spending of $7.35 trillion in 2027 (Gartner, Gartner, Gartner). Those are forecasts.
How many people work there depends on who counts. The three federal programs below count different units (employers' payroll reports, establishments surveyed in March, wage-survey responses), so their totals differ by more than 350,000 people.
U.S. software publishers by three federal counts
Program
Year
Employment
Establishments
Pay
BLS Quarterly Census of Employment and Wages (private, NAICS 513210)
The QCEW and Census establishment counts differ more than fivefold because the programs define a reporting unit differently, so neither should be read as a count of companies. Payroll employment in software publishing stood at 660.4 thousand in December 2025 (BLS), against 332,271 private jobs in 2015 under the older industry code (BLS). BLS projects software publisher employment to grow 14.2% from 2025 to 2035, against 3.5% for all jobs, and real output to reach $902.6 billion in 2035 in chained 2017 dollars (BLS, BLS, BLS).
Who inside a software company makes the demo?
Mostly people who are not video specialists. In May 2025, U.S. software publishers employed 173,080 software developers but only 180 film and video editors, 0.7% of the 25,610 editors on payrolls across all industries (BLS, BLS, BLS). The occupations closest to demos are larger: 12,990 marketing managers, 23,490 market research analysts and marketing specialists, 3,920 special effects artists and animators, 3,220 sales engineers, who run most live technical demos, and 2,630 technical writers (BLS, BLS, BLS, BLS, BLS). OEWS counts wage and salary jobs only, so freelancers are missing.
Median annual wage at U.S. software publishers, May 2025, and projected U.S. employment change for the occupation in all industries, 2025 to 2035 (BLS)
How much software is bought without a salesperson?
For some of the biggest names, most of it. Public companies' annual reports describe the split. In its 10-K for 2025, Dropbox says more than 90% of its revenue comes from self-serve channels, people who subscribe in its app or on its website, and it counted 18.08 million paying users against more than 700 million registered, at most 2.6% by our calculation (Dropbox, Dropbox). Zoom's Online customers, who buy through its website without a sales team, produced 39.7% of revenue in the year to January 2026, down from 42.1% two years earlier, and churned 2.8% of monthly recurring revenue a month (Zoom, Zoom). Docusign had over 1.8 million customers, of which about 280,000 were enterprise and commercial accounts handled by its sales force and partners, about 15.6% by our calculation (Docusign, Docusign). Atlassian says it lands customers through a self-service purchasing flywheel and serves more than 350,000 (Atlassian); GitLab reports more than 50 million registered users and a free tier meant to remove barriers to entry (GitLab).
Others mix both. HubSpot describes a freemium model in which customers start on free products before paying or talking to sales, and reported 288,706 paying customers at the end of 2025 (HubSpot). At the end of January 2026, Asana had over 180,000 paying customers, of which 25,928 spent $5,000 or more a year (Asana). monday.com and Freshworks both describe a 14-day free trial as the way in (monday.com), and Freshworks calls its website the primary channel for buyers to learn about its products, with a 14-day trial to try before buying (Freshworks). At Figma, non-designers made up about two-thirds of monthly active users at the end of 2025 (Figma).
What the popular product demo numbers really say
Demo-tool and video-agency blogs repeat a small set of figures. We traced each to the organization that first published it, using exact-phrase searches for the figure and its older wordings, Internet Archive captures of the vendors' pages and blogs, and trade press of the period. Some have no origin at all; most began as a narrower measurement than the one now quoted.
"73% of buyers prefer to watch a video to learn about a product"
This is one year's answer from Wyzowl's consumer survey, not a study of buyers. Wyzowl's 2022 edition, from 582 respondents surveyed in December 2021, was the first to print 73% for people who would most like to learn about a product or service by watching a short video (Wyzowl). The question offered a menu of formats; in the same edition, 3% picked a sales call or demo (Wyzowl). The answer has moved every year:
Wyzowl: share who would most like to learn about a product or service by video, every edition
The answer swung 34 points between the 2024 and 2025 editions (our calculation, from 44% to 78%), on samples of a few hundred people recruited online by a company that sells explainer videos. Software vendors now repeat it as a fact about software users: Guidde, which sells video guide software, writes that "research consistently shows" 73% of users prefer video over text when learning software, with no source (Guidde). A different 73% also circulates, from Animoto's 2014 survey of U.S. consumers: Nearly three quarters were more likely to buy after watching a video explaining a product (Animoto). Use instead: the latest Wyzowl edition with its year and sample, 63% of 266 respondents in 2026, and say it is a consumer survey.
"Buyers are 2.3x more likely to buy after a demo"
We found no origin. The one page that gives a source, Contrast's guide to interactive demo software, credits a "2023 McKinsey report" with finding that B2B companies investing in advanced digital sales experiences are 2.3 times more likely to outperform peers (Contrast); we could not find that report or the figure, and the claim as quoted is about companies, not buyers. The only 2.3x we found in a demo vendor's own data is Arcade's finding that viewers who get past step 7 are 2.3 times more likely to finish the demo, a completion figure. Use instead: a dated, scoped vendor figure such as Navattic's 72% win rate for deals that received an automated demo within 14 days, against 59% for deals with none, and say it comes from the vendor's customers.
"TechSmith: video onboarding means 25% faster adoption"
No TechSmith page we found says this. The nearest claim, on Guidde's knowledge hub, credits "a 2026 study by TechSmith" with finding that learners retain 25% to 60% more information from video than from text (Guidde). That range is much older and is not about video: a March 2000 equity research paper by WR Hambrecht + Co said e-learning raises retention by 25 – 60% (WR Hambrecht + Co). What TechSmith has published is a preference: 83% of its 2024 respondents prefer video for instructional content. The one 25% about adoption we found is Pendo's: customers who deployed at least 25 in-app guides raised the number of features used daily by 25%, a result about in-app guides. Use instead: TechSmith's 83%, labeled as a preference survey by a screen-recording vendor.
"Interactive demos convert 7.9x better"
This comes from one vendor study with a loose baseline. Storylane and Factors.ai reported in October 2024, from 110,257 web sessions and 150 deals, that visitors who engaged with an interactive demo converted at 24.35%, 7.9x the dataset's 3.05% average (Storylane, Storylane). The comparison is with the average of all sessions, not with a group that saw no demo, and visitors who choose to open a demo are already more interested. The same study put deal conversion for demo-engaged prospects at 3.2x the sample average, and deals with demo touchpoints closed in 27 days against 33 (Storylane, Storylane), 18% faster by our calculation. Walnut repeats the 7.9x and credits it to "Contrast/Factors.ai" (Walnut), and a 2026 statistics page turns it into demo viewers converting at 7.9 times the rate of non-viewers (Mean CEO), a comparison the study did not make. Arcade's 7.2x and Navattic's 12% are similar vendor-built comparisons with video. Use instead: the 7.9x only with its baseline, "against the average of all sessions in one vendor's 2024 dataset".
"Shoppers are 85% more likely to buy after watching a product video"
This began as one golf retailer's remark. In October 2009, SLI Systems blogged that Online Golf's Lee Brown said people who view a video on the UK retailer's site are 85% more likely to buy than those who don't (SLI Systems). Viewers and non-viewers are different people, so the gap is not an effect of the video. Consensus, which sells demo automation software, still headlines it as 85% "when compared to a control group" and credits Internet Retailer 2010 (Consensus), a year after SLI's post, whose figure compared viewers with non-viewers. A similar viewer-versus-non-viewer comparison by Invodo found retail shoppers who watched video on its clients' sites from April to September 2013 were 1.81x more likely to buy (Invodo); a 2026 statistics page now describes that as shoppers who view demo videos being 1.81× more likely to purchase (Mean CEO).
"Explainer videos lift conversions 20%, 64% or 80%"
Each is a single test. The 80% is the best case in EyeView Digital's 2010 white paper, "in some cases the boost in conversion was over 80%" (EyeView Digital); the one test it describes in full, on a forex trading site's landing page, found conversion almost 32 percent higher with the video (EyeView Digital). It is still quoted as "up to 80%" (Mean CEO). The 20% is one client result: Switch Video says a video it made for Rypple around 2013 raised conversions 20% in a split test (Switch Video), which Consensus credits to Work.com, Rypple's later name, at 20% (Consensus). The 64% is one split test, around 2012, on Crazy Egg's home page by the agency Conversion Rate Experts, where the version with a video produced 64% more conversions (Conversion Rate Experts). The 4.8% against 2.9% figure is Aberdeen Group's November 2014 comparison of companies' self-reported conversion rates, 4.8% for companies using video content (Aberdeen Group); Sendspark repeats it as 4.8% for websites with video (Sendspark) and a 2026 list as landing pages with demo videos converting at 4.8% (Mean CEO). Use instead: run your own split test; none of these predicts a lift on another site.
"Viewers retain 95% of a message in video and 10% in text"
This first appears, unsourced, in a 2013 statistics list by the marketing agency Insivia, "95% of a message when they watch it in a video" (Insivia). Insivia now says the figure came from a small survey of around 200 B2B buyers it ran in the late 2000s and calls it directional (Insivia). Guidde still presents the 95% as something "studies show" (Guidde). No retention study we know of supports it.
"Buyers are 57% of the way through before they contact sales"
This is CEB's 2012 research. CEB's Marketing Leadership Council found in a 2011 survey that the average B2B customer had completed more than half of the purchase decision before engaging a supplier's rep, and as much as 70% at the upper limit (CEB); Google's February 2013 write-up of the research gives 57 percent (CEB via Google). Newer versions drift upward with no new source: Walnut, which sells interactive demo software, said in August 2026 that 83% of the B2B buying decision happens before a rep is involved and credited Gartner's 2026 buyer research (Walnut); we found no Gartner 83%. Use instead: 6sense's yearly measure, 69% of the way through in 2023 and a 60/40 split in 2025, or Gartner's 17% of buying time spent with suppliers.
"98% (or 96%) of people have watched an explainer video"
Both are Wyzowl's, from different years. Its 2016 edition said 98% of users had watched an explainer video to learn more about a product or service (Wyzowl); its 2026 edition says 96%, and the editions in between ranged from 91% to 98% (see the Wyzowl table). The question asks whether someone has ever watched one, so it says nothing about whether the video helped.
We started from the questions people search for about product demo video statistics and looked for the organization that actually produced each answer. Every figure on this page sits in an evidence ledger with its source, the exact table or paragraph it came from, the measurement period, the population measured, and the date we checked it. This edition holds 355 figures from 55 publishers.
On October 31, 2026, each of the sourced figures on this page was re-fetched with the fetch cache cleared and matched against the recorded wording: BLS wage and employment figures through the BLS data API, Census figures through the Census data API (the page links the matching data.census.gov tables), SEC filings from EDGAR, and pages that refuse scripts (gartner.com, 6sense.com, trustradius.com, bls.gov) through dated Internet Archive captures. Our own figures come from a headless-browser read of 145 software publishers' homepages and the pages behind their demo buttons on October 31, 2026, and a YouTube Data API read of the channels they link to; the per-company data is published in software-homepages.csv and youtube-uploads.csv. We left out figures we could only find in roundups, pages whose robots rules bar our agents (Vidyard, Skilljar), HubSpot's State of Marketing (no open method), and one TrustRadius demo figure that appears only in secondary coverage.
We only cite the producer: government agencies, regulators, company filings and official posts, and the survey owner's own report. We do not cite statistics roundups, Statista-style aggregators, or salary sites without a public method. We did not bypass paywalls or sign-up forms; where a full report was gated, we used only the figures its publisher states publicly.
Figures marked "our calculation" are arithmetic on the cited numbers, and anyone can reproduce them:
This edition contains no Mark Studios customer data.
Limitations
Our homepage sample is the biggest companies, read once. The 145 companies are the largest SEC-reporting software publishers (SIC 7372) with a 10-K, so they lean toward enterprise and public-market software and include consumer apps and games under the same code. Homepages change often, and 12 refused a headless browser or failed to load; they are left out, not guessed.
Our label rules are mechanical. A demo button is any link or button labeled with the word demo; a form is a visible email field or an embedded form from a known form host. A form inside an unusual frame, or a demo page that loads its form late, can be missed, so the share of demo buttons leading to a form is a floor.
Most demo and video figures come from vendors. Navattic, Arcade, Storylane, HowdyGo, Supademo, Consensus, Chili Piper, RevenueHero, Wistia, Wyzowl, TechSmith, Pendo and WalkMe sell into this market and report on their own customers or samples. Each defines its measures its own way, which is why the page shows them side by side instead of averaging them.
Buyer surveys are not samples of all buyers. Gartner, Forrester, 6sense, TrustRadius, G2 and Capterra each recruit their own panels; several do not publish field dates or exact questions on open pages, and some open pages are archive copies.
Wyzowl's consumer survey is small and changes year to year. Its samples range from about 200 to under 1,000 people recruited online, and its answers swing by tens of points between editions.
Federal counts describe the U.S. software industry, not demo work. BLS and Census count employers, establishments and wage-earning jobs, so freelancers and agencies that make demos for software companies are not in them.
How to cite this page
For a single figure, cite the original publisher named next to it, and link here if the verification trail is useful to your readers. Each figure has its own anchor, so you can link straight to it, for example https://www.markstudios.com/research/product-demo-video-statistics#DRV-019. To cite the page as a whole:
Mark Studios. "Product Demo Video Statistics." Last verified Oct 31, 2026. https://www.markstudios.com/research/product-demo-video-statistics
APA
Mark Studios. (2026, October 31). Product demo video statistics. https://www.markstudios.com/research/product-demo-video-statistics
MLA
“Product Demo Video Statistics.” Mark Studios, 31 Oct. 2026, www.markstudios.com/research/product-demo-video-statistics.
Chicago
Mark Studios. “Product Demo Video Statistics.” Last modified October 31, 2026. https://www.markstudios.com/research/product-demo-video-statistics.
BibTeX
@misc{markstudios_product_demo_video_statistics_2026,
  author = {{Mark Studios}},
  title = {{Product Demo Video Statistics}},
  year = {2026},
  month = oct,
  url = {https://www.markstudios.com/research/product-demo-video-statistics},
  note = {Last verified 2026-10-31}
}
Our calculations and the evidence table are free to reuse with attribution and a link to this page. Each underlying figure remains the claim of its original publisher, and some publishers ask for a link when their figures are reused.
We re-verify every figure quarterly and when a major source publishes a new edition. The next scheduled review is January 2027. Corrections go to contact@markstudios.com.
Oct 31, 2026: First published with 355 figures from 55 publishers, each checked against its original source.
Oct 31, 2026: Corrected the same day: the 9.26% "Product Tour" figure is now described as the single button label Navattic's 2024 report counted, so it no longer reads as a second figure for the 2026 report's "12% in 2024"; the Animoto line now reads as its own sentence.
Oct 31, 2026: Clarified: eleven sentences now give the year their figures come from, among them Gartner's buying-journey research (around 2019) and its 2025 software buyer survey, Navattic's 2024 and 2025 data, Pendo's 2018 base, Dropbox's and Asana's filings, and the dates of the Rypple, Crazy Egg and CEB figures; the Online Golf retailer is now identified as British.
Frequently asked questions
How many software companies offer a demo on their homepage?
Most large ones. On October 31, 2026, 58.6% of the homepages of the largest SEC-reporting software publishers carried a button labeled with the word demo, and 56.4% asked visitors to request one. Navattic's 2026 scan of about 5,000 B2B SaaS websites found 61% with a Book a Demo button.
What happens when you click a software company's demo button?
Usually you get a form. Of the demo buttons we followed on those homepages, 76.7% opened a page with a form asking for contact details, and 64.4% opened a form with nothing to watch. Only 5.5% let a visitor watch a video or click through an interactive demo without filling anything in.
Do B2B buyers want to talk to sales before buying software?
Less and less. In Gartner's survey of 646 B2B buyers in 2025, 67% said they prefer a rep-free buying experience, up from 61% in 2024. 6sense's 2025 survey found buyers now engage sellers around 60% of the way through, and 94% of buying groups had ranked their preferred vendors before first contact.
What is a good interactive demo completion rate?
It depends on the definition. Storylane's sample averaged 26% of sessions, Arcade reports a 58% median among people who start a demo, and HowdyGo a 50.0% median among engaged viewers. In Navattic's 2026 report, the top 10% of demos completed at 40% of all visitors.
How long should a product demo video be?
Short, for a first look. 71% of the video marketers in Wyzowl's 2026 survey said videos between 30 seconds and 2 minutes work best, and in our count the median demo-titled long-form video on big software companies' YouTube channels ran 3.7 minutes. Live sales demos run much longer: in Gong's 2017 study, demos that led to closed deals averaged 47 minutes.
Is it true that 73% of buyers prefer to learn about a product by video?
Not as usually quoted. The 73% is the 2022 answer in Wyzowl's survey of consumers, not B2B buyers, to a question about how they would most like to learn about a product or service. The same question gave 44% in Wyzowl's 2024 edition and 63% in 2026.
How often is this page updated?
Every figure is re-checked against its original source each quarter, and sooner when a major source publishes a new edition, such as Wyzowl's survey each January, the vendors' annual demo benchmarks, and the BLS wage survey each spring. The Last verified date changes only after that check, and each change is recorded in the change log.