Every figure on this page links to the organization that produced it, and each was re-checked against that source before publishing. What the 200 largest U.S. nonprofit hospitals do with video on their homepages and YouTube channels (our own measurement), how many Americans use video visits and watch health videos, what the trials say about patient-education video, the platform and FDA rules, and where the popular healthcare video numbers came from.
Only 21.0% of the largest U.S. nonprofit hospitals' homepages showed a video on October 31, 2026: 12.2% embedded a click-to-play player and 6.6% a muted background loop. (Our measurement)See details
87.3% of those homepages linked to YouTube and 69.6% linked to it without showing any video themselves; 13.3% linked to TikTok. (Our measurement)See details
51.4% of the hospital homepages linked to virtual care or telehealth, but only 12.2% showed that link in the first screen, and 7.7% used the words video visit. (Our measurement)See details
The 152 hospital YouTube channels posted 17,752 videos in the year to October 31, 2026; 34.1% were Shorts, and the median channel posted 70 videos and had 14,250 subscribers. (Our measurement)See details
59.6% of U.S. adults watched health-related videos on social media in 2022, up from 30.1% in 2017, in the National Cancer Institute's HINTS survey. (National Cancer Institute HINTS)See details
37.0% of U.S. adults had a telemedicine visit in 2021 and 30.1% in 2022, the CDC's latest published year. (CDC NCHS)See details
Older patients use the phone more than video: adults 65 and over did 56.5% of their telehealth visits by audio only in 2021, and Medicare enrollees 53.9% in 2021-22. (HHS ASPE)See details
The share of eligible Medicare beneficiaries using telehealth fell from 47.91% in 2020 to 23.25% in 2025, a drop of 51.5%. (CMS; our calculation)See details
Video and other consent aids reliably raise what patients know (Cochrane SMD 0.53) but not their anxiety (SMD -0.11); before adult surgery, multimedia left anxiety unchanged in 10 out of 14 comparisons. (Cochrane; Anaesthesia)See details
The '7% of Google searches are health-related' line comes from a 2019 Telegraph paraphrase, whose 70,000-a-minute rate is only about 100.8 million a day; Google itself has said one in 20. (The Telegraph; Google; our calculation)See details
The '30% of patients who watch a hospital video book an appointment' figure is a 2012 Google/Compete survey in which only 1 in 8 respondents watched video, so watchers who booked were about 3.75% of the sample. (Google / Compete; our calculation)See details
What do the largest U.S. hospitals do with video?
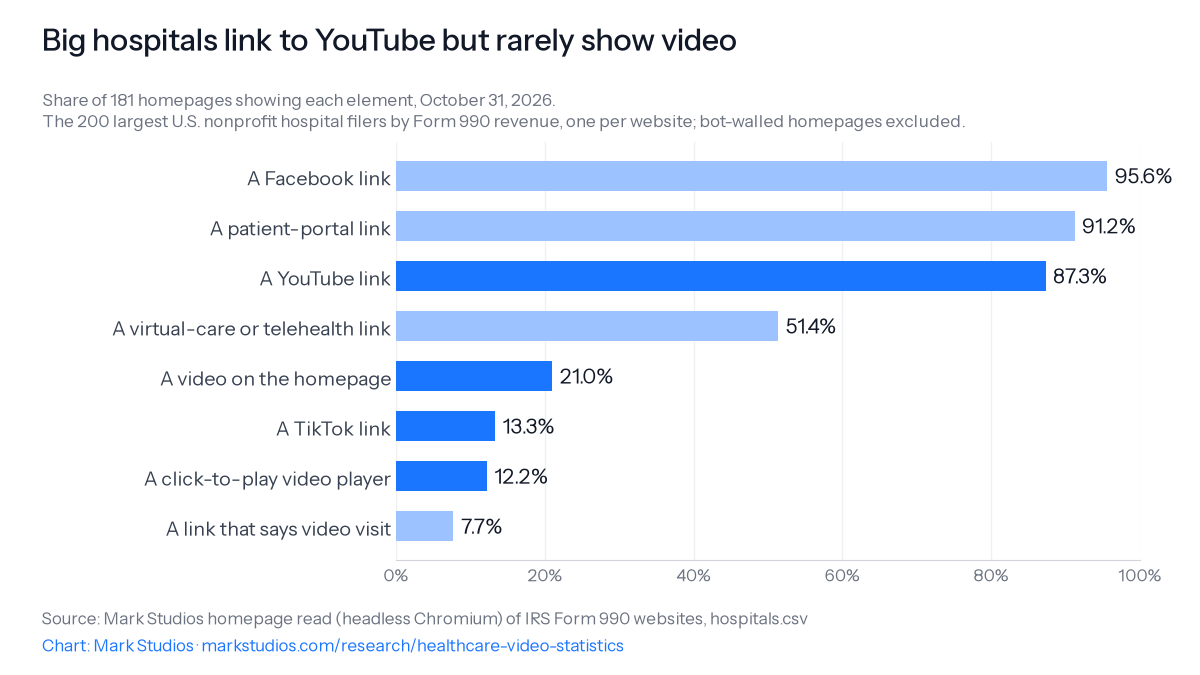
They link to YouTube, but few put video on the homepage. On October 31, 2026 we read the homepages of the 200 largest U.S. nonprofit hospital filers, ranked by total revenue on their latest e-filed IRS Form 990 (Business Master File foundation code 12, one filer per website; together $640.9 billion in revenue). We could read 181 of them; 8.5% refused a headless browser and are left out. 21.0% showed a video on the homepage and 11.6% showed one in the first screen of a desktop window. 6.6% played a muted background loop with no controls, and 12.2% embedded a click-to-play player. Of the homepages with video, 31.6% used it as a silent background.
The same probe found video on 31.9% of the largest U.S. charities' homepages in our nonprofit video statistics, so big hospitals use homepage video less than big charities do.
Big hospitals link to YouTube but rarely show videoShare of 181 homepages showing each element, October 31, 2026. The 200 largest U.S. nonprofit hospital filers by Form 990 revenue, one per website; bot-walled homepages excluded.
Social links are nearly universal: 95.6% of the readable hospital homepages linked to Facebook, 91.2% to Instagram, 87.3% to YouTube, 81.8% to LinkedIn and 68.5% to X, but only 13.3% to TikTok. 69.6% linked to YouTube without showing any video on the homepage itself.
Care links outnumber video. 91.2% linked to a patient portal, 63.5% by the name MyChart, and 76.2% put the portal link in the first screen. 51.4% carried a link or button for virtual care, a virtual visit or telehealth, but only 12.2% showed one visibly in the first screen (many sit in menus that open on click), and 7.7% used the words video visit, video appointment or video consult.
What do hospital YouTube channels post?
Mostly short videos with small audiences. We followed the first YouTube channel link on each readable homepage to 152 distinct channels and read every upload from November 1, 2025 to October 31, 2026 with the YouTube Data API. 97.4% of the channels posted in that year, 17,752 videos in all. The median channel posted 70 videos, a little more than one a week, and had 14,250 subscribers. One channel, the Cleveland Clinic's, posted 5.7% of all the uploads.
Shorts were 34.1% of hospital uploads, and 26.9% of the median active channel's. 80.4% of active channels posted at least one Short. Live streams were 0.7% of uploads. The median long-form upload ran 146 seconds and had 159 views when we read it; the median Short ran 46 seconds and had 393 views. View counts are a snapshot, and recent uploads have had less time to collect them. The per-hospital data is in hospitals.csv and every upload in youtube-uploads.csv.
How many Americans use telehealth and video visits?
About three in ten adults a year, down from the 2021 peak. The CDC's National Health Interview Survey found 37.0% of U.S. adults had a telemedicine appointment (video or phone) in the past 12 months in 2021, falling to 30.1% in 2022 (CDC NCHS; CDC NCHS). NCHS has not published a newer adult figure. In 2021, 42.0% of women used telemedicine against 31.7% of men (CDC NCHS), use rose with age to 43.3% of adults 65 and over (CDC NCHS), and it fell to 27.5% in the most rural counties (CDC NCHS).
Measured over four weeks instead of a year, the Census Household Pulse Survey put telehealth use at 23.1% of adults between April and October 2021 and an average of 22.0% from April 2021 to August 2022 (HHS ASPE; HHS ASPE).
How much of telehealth is actually video?
A bit more than half for all adults, less than half for older patients. In every Household Pulse wave from July 2021 to August 2022, more than half of adult telehealth users had a video visit rather than audio only (HHS ASPE). The video share was highest among adults 18 to 24, at 72.5% of their visits (HHS ASPE). Adults 65 and over did 56.5% of their telehealth visits by audio only (HHS ASPE), Medicare enrollees 53.9% (HHS ASPE), and adults without a high school diploma 64.2% (HHS ASPE).
Medicare's own data shows the same split. Among Medicare beneficiaries with a telehealth visit in summer and fall 2020, 56% used the telephone only and 28% video (KFF analysis of CMS data); about 27% of all community-dwelling beneficiaries had a telehealth visit in that period (KFF). In MedPAC's 2022 beneficiary survey, 35 percent had a telehealth visit in the past year, but only 19 percent a video visit (MedPAC; MedPAC). In traditional Medicare evaluation and management visits, the audio-only share of telehealth fell from 31.0% in 2020 to 25.4% in 2022 (JAMA Health Forum). HHS found that up to 70% of Medicare fee-for-service telehealth visits in 2020 could have been billed as audio-only, and 92% of users got their visits at home (HHS ASPE; HHS ASPE).
How has Medicare telehealth use changed since 2020?
It has halved. CMS counts the share of fee-for-service beneficiaries with a telehealth-eligible service who used telehealth: 47.91% in 2020 and 23.25% in 2025 (CMS, CMS), a relative drop of 51.5%. The measure counts audio-only visits as telehealth, so it cannot be split into video and phone.
Medicare fee-for-service beneficiaries with a telehealth-eligible service who used telehealth (CMS Medicare Telehealth Trends)
Quarterly shares run lower than yearly ones because fewer people have any visit in a single quarter; Q4 2025 also overlaps the October 2025 lapse in Medicare's telehealth flexibilities. Rural beneficiaries used telehealth less than urban ones in 2025 (18.44% against 24.74%; CMS, CMS), as they have every year since 2020, when 39.81% of rural beneficiaries used it (CMS). Under-65 beneficiaries, who qualify through disability, used it most: 35.91%, against 21.46% at ages 65 to 74 and 22.91% at 85 and over (CMS, CMS, CMS). Fee-for-service visits had risen from about 840,000 in 2019 to 52.7 million in 2020 (HHS ASPE).
CMS says beneficiaries can get telehealth anywhere in the U.S., including at home, through December 31, 2027 (CMS), and audio-only care at home is allowed through December 31, 2027 as well (CMS).
What about commercial insurance and the VA?
Commercial telehealth is steady at about one claim line in twenty. FAIR Health, an independent nonprofit that keeps a national database of private claims, counted telehealth at 0.15% of commercial medical claim lines in April 2019 and 13.00% in April 2020 (FAIR Health). It was 5.1% in January 2025, 5.51% in Q1 2026 and 5.6% in Q2 2026 (FAIR Health; FAIR Health; FAIR Health). Counted by patient, 14.9% of commercially insured patients with a claim had a telehealth claim in January 2025, 18.4% in Q1 2026 and 18.3% in Q2 2026 (FAIR Health; FAIR Health; FAIR Health). Rural patients used it less (18.6% urban, 10.3% rural), and mental health conditions accounted for 52.1% of telehealth patients in Q1 2026 (FAIR Health; FAIR Health).
The Department of Veterans Affairs runs the largest single video-visit program in the U.S. In fiscal 2025, more than 2.9 million veterans used VA telehealth (VA), and more than 2.1 million had 11.7 million video visits at home through VA Video Connect (VA), up from 3.8 million home video appointments in fiscal 2020 (VA). 92.9% of veterans were satisfied with their video visits (VA).
How many doctors offer video visits?
Most office-based physicians, though fewer than in 2021. NCHS found telemedicine use among office-based physicians rose from 15.4% in 2019 to 86.5% in 2021 and stood at 80.0% in 2024 (CDC NCHS; CDC NCHS). Surgical specialists dropped most, to 60.1%, and physicians outside metro areas fell to 60.9% (CDC NCHS; CDC NCHS). In 2021, 27.4% of medical specialists used telemedicine for half or more of their visits (CDC NCHS). The American Medical Association's own physician surveys agree: 80% of physicians used tele-visits in 2022, up from 14% in 2016 (AMA), 57% named them the digital tool they were most enthusiastic about (AMA), and 71.4% worked in practices that used telehealth in 2024 (AMA).
How many people watch health videos online?
About six in ten U.S. adults, double the share five years earlier. The National Cancer Institute's Health Information National Trends Survey (HINTS) found 59% of Americans had watched a health-related video on YouTube in the past 12 months in 2022 (National Cancer Institute). A peer-reviewed analysis of the same survey put the share watching health videos on any social media at 59.6% in 2022, up from 30.1% in 2017 (Journal of Medical Internet Research), 1.98 times as high. Rural adults caught up: from 22.4% in 2017 to 58.0% in 2022 (JMIR).
U.S. adults who watched a health-related video online in the past 12 months, NCI HINTS (different analyses and bases)
From clinicians first, then search, with social media a minority source. In Pew Research Center's October 2025 survey, 85% of U.S. adults got health information from health care providers at least sometimes, 60% from major health websites such as WebMD or Mayo Clinic, 66% from people with a similar health issue, and 36% from social media (Pew; Pew; Pew; Pew). 73% used three or more of the seven sources Pew asked about (Pew). Social media use for health was higher among Hispanic adults, at 49%, than White adults, at 30% (Pew).
KFF's early-2026 poll found 68% of adults had used a search engine for health information in the past year and 32% an AI chatbot (KFF; KFF); Pew put AI chatbot use for health at 34% in June 2026 (Pew). The CDC's NHIS found 58.5% of adults looked for health information online in the second half of 2022 (CDC NCHS): 63.3% of women and 53.5% of men, and up to 67.2% at ages 30 to 44 (CDC NCHS; CDC NCHS). In 2012, Pew found 72% of internet users had looked for health information online and 77% of them started at a search engine (Pew; Pew). In the EU, Eurostat counted 60.28% of people aged 16 to 74 seeking health information online in 2025, 53.61% on physical health and 23.74% on mental health (Eurostat; Eurostat; Eurostat), up from 38% in 2011 (Eurostat).
How many use TikTok, YouTube and influencers for health advice?
A majority sees health content there; few trust it. In KFF's July 2025 poll, 55% of U.S. adults used social media to find health information at least occasionally, and 11% did so every day (KFF; KFF). 72% had seen weight loss, diet or nutrition content in the past 30 days and 38% vaccine content (KFF; KFF). Fewer than one in ten users trusted most of it, while at least three in ten YouTube, TikTok and Reddit users trusted some (KFF). Young users trusted it more: 54% of TikTok users 18 to 29 (KFF).
In the same July 2025 poll, 15% of social media users regularly got health advice from influencers, ranging up to 21% of TikTok users (KFF; KFF), and 61% of those said the influencers were mostly after money (KFF). In spring 2024, 44% of adults used TikTok (KFF); 66% of TikTok users had seen mental health advice there, 91% of those under 30 (KFF; KFF). Only 9% trusted TikTok health information a great deal, 53% of users under 30 trusted it at least somewhat, and 13% had talked to a doctor partly because of something they saw (KFF; KFF; KFF).
Pew found four in ten adults ever got health and wellness information from influencers or podcasts in 2025 (Pew), including 57% of women 18 to 29 (Pew); only 10% of those listeners trusted all or most of it (Pew). Of 6,828 prominent health and wellness influencers Pew identified, 86% were on Instagram, 62% on TikTok and 45% on YouTube, and 41% described themselves as some kind of health care professional (Pew; Pew).
Do people trust online health video, and should they?
Doctors remain the most trusted source. In HINTS 2018, 94.2% of Americans trusted doctors some or a lot for health information, against 64% for the internet (National Cancer Institute). In October 2025, Pew found 65% of adults who get information from providers rated it very accurate, while 47% of those who get it from social media rated that not too or not at all accurate, and 38% of all adults found it somewhat difficult to judge accuracy (Pew; Pew; Pew).
Studies that rate health videos find a large share misleading, though each covers one topic and the most viewed videos only, so they should not be averaged:
Share of health videos rated misleading or non-factual, by study
Most-viewed YouTube COVID-19 vaccine videos, July 2021 (BMJ Global Health)
Top videos
About 11% contradicted WHO or CDC
YouTube videos by health professionals, cancer and diabetes (JAMA Network Open)
309
62.5% of claims had very low or no evidence
In that last study, videos with weak evidence drew 34.6% more views than well-supported ones (JAMA Network Open).
Does patient-education video work?
For knowledge and recall, usually yes; for anxiety, it depends on the procedure. The 2013 Cochrane review of 65 randomized trials (9,021 patients) of ways to improve informed consent for surgery and invasive procedures, including audio-visual material, found better knowledge right afterwards (standardized mean difference 0.53) but no significant effect on general anxiety (SMD -0.11, confidence interval crossing zero) (Cochrane; Cochrane). A 2014 meta-analysis of 29 trials of audiovisual consent aids found better immediate recall (SMD 0.64) but no consistent effect on satisfaction or anxiety across its 29 trials (Patient Education and Counseling; Patient Education and Counseling). A 2020 review found 56% of passive audiovisual consent interventions improved comprehension, against 85% of interactive digital ones (Medical Decision Making; Medical Decision Making). For trial consent, a 2014 Cochrane review of 16 studies found low-quality evidence of a slight gain in knowledge (Cochrane).
Does video before a procedure reduce anxiety?
Sometimes. The best evidence is mixed, and the effect is larger for children and for some procedures than for adult surgery overall. A 2017 review of trials before scheduled surgery found multimedia left anxiety unchanged in 10 out of 14 comparisons, though it raised knowledge more than text (Anaesthesia).
What trials and reviews found about video and pre-procedure anxiety
Information video did not shorten scans (34.54 vs 39.38 min)
Does video change what patients do?
For bowel preparation, yes. A 2020 meta-analysis of 8 trials (1,977 colonoscopy patients) found educational video raised the chance of adequate preparation (risk ratio 1.20) (Annals of Palliative Medicine), and a 2021 network meta-analysis found video beat visual aids and apps (odds ratio 2.33) (JMIR). An earlier review of seven controlled studies was less certain (PLOS ONE). In China, virtual-reality video raised Boston Bowel Preparation scores to 7.61 from 7.04 (JAMA Network Open); in a Dutch trial, computer education with video was only as good as a nurse, 93.2% adequate cleansing against 94.0% (Endoscopy).
Discharge trials are small. Video clips raised emergency patients' knowledge of their diagnosis to 8.28 from 5.87 on an 18-point scale in Italy (npj Digital Medicine); a U.S. urology trial with 11 patients per arm found better comprehension (Transl Androl Urol); and in Turkey, video and booklet fever instructions both beat verbal ones, with fewer readmissions after video than after verbal instructions (a mean of 1.12 against 1.54) (International Emergency Nursing). A non-randomized U.S. study linked smartphone discharge video after a stent procedure to 97.5% medication adherence against 74.4% (J Cardiovasc Nurs). A 2014 review of 28 studies (12,703 people) found video changed some health behaviors, such as screening and self-care, but not others (Journal of Behavioral Medicine).
The largest video trials: advance care planning
The biggest randomized tests of patient video are advance-care-planning decision aids. In the VIDEO-KD trial (453 older adults with advanced kidney disease), 56.6% of patients shown a video had a care plan documented within a year, against 40.0% with usual care (JAMA Internal Medicine), and only 13.2% stayed undecided about treatment (JAMA Internal Medicine). An emergency-department trial raised documentation to 45.6% from 31.3% (J Gen Intern Med), with a median goal-concordance score of 10 against 7 among patients who died (J Gen Intern Med). Across 29 oncology practices (13,800 patients), video plus clinician training added 6.8 percentage points of documentation (JAMA Network Open), and in two hospitals documentation reached 62.2% against 50.1% (JAMA Network Open).
Video only works if patients see it. In the PROVEN trial in 360 nursing homes, hospital transfers did not fall (rate difference -0.2 per 1,000 days) and only 21.9% of residents were recorded as having watched a video (JAMA Internal Medicine; JAMA Internal Medicine). Earlier trials changed preferences: 86% chose comfort care after a dementia video against 64% after a description, and 6% changed their minds six weeks later (BMJ; BMJ); 20% of cancer patients wanted CPR after a CPR video against 48% after a narrative (J Clin Oncol); and 91.3% of glioma patients preferred comfort care after a video (J Clin Oncol). Meta-analyses put the drop in CPR preference at a risk ratio of 0.50 (2015, 10 trials) and 0.54 (2023, 14 trials), with knowledge up by SMD 0.58 (BMJ Open; J Hosp Palliat Nurs; BMJ Open); trials using resuscitation videos lowered preference for life support (RR 0.56) where talk alone did not (JAMA Network Open). But a 2026 network meta-analysis of 13 trials ranked paper decision aids above video for getting plans documented (BMJ Supportive & Palliative Care).
Why video: health literacy
The last national measurement, the 2003 National Assessment of Adult Literacy, found 14 percent of U.S. adults had below-basic health literacy, 22 percent basic and only 12 percent proficient (NCES; NCES; NCES), over 75 million adults at basic or below (NCES). 30 percent of Medicaid recipients were below basic (NCES). AHRQ's tool for judging patient videos, PEMAT-A/V, has 17 items, 13 for understandability and 4 for actionability (AHRQ; AHRQ). The "70% passing score" that vendors cite is not in AHRQ's guidance, which says only that a higher score, say 90% against 60%, is better (AHRQ).
What do YouTube, TikTok and regulators require of health video?
YouTube gives licensed health sources a label and search placement once they clear a viewing bar. To qualify for YouTube's health features, a licensed professional's or organization's channel needs more than 1,500 valid public watch hours in the last 12 months, or 1.5 million Shorts views in 90 days (YouTube Help). When YouTube opened the program to UK professionals in June 2023 the bar was 2,000 watch hours (YouTube Official Blog). YouTube says it decides an application in about 1-2 months (YouTube Help), and the application is open to providers in 10 countries (YouTube Help), while its first-aid search shelf runs in 11 countries (YouTube Help). U.S. professionals could first apply on Oct 27, 2022 and UK ones on Jun 12, 2023 (YouTube Official Blog; YouTube Official Blog). Of the 152 hospital channels we read, the median had 14,250 subscribers, so the bar is about viewing, not size.
YouTube publishes health viewing only by country and campaign. It says health condition videos drew over two billion views in the UK in 2021 (YouTube Official Blog). In India it reported 75 billion health views in 2023 and, in a November 2025 post, 300 billion the previous year, without defining either, so the two cannot be compared (Google India Blog; Google India Blog); it said in 2025 that mental health viewing in India rose 20% in a year (Google India Blog). By March 2021 its COVID-19 information panels had been viewed 400 billion times, it had removed more than 850,000 videos under its COVID-19 misinformation rules, and it had worked with more than 85 health authorities (YouTube Official Blog; YouTube Official Blog; YouTube Official Blog). Its Harvard Medical School continuing-education channel launched with nine credit-eligible playlists (YouTube Official Blog), and its health-equity creator fund offered up to $10,000 per creator (YouTube Official Blog). Under its medical misinformation policy a first violation usually brings a warning that expires 90 days after optional training (YouTube Help), and three strikes in the same 90-day period can remove a channel (YouTube Help).
TikTok reports health work in funds and impressions. Its 2025 mental health fund gave $2.3 million in ad credits to 31 organizations (TikTok Newsroom); it says the fund has brought organizations more than 173 million impressions (TikTok Newsroom). Since October 2023, U.S. searches for 40 mental health and neurological conditions point to NIMH and Cleveland Clinic information (TikTok Newsroom), its safety guides reach more than 500,000 people a month (TikTok Newsroom), and it gave the WHO $3 million in 2024 (TikTok Newsroom). In the second half of 2020 its COVID-19 hub was viewed 2,625,049,193 times, health-hashtag notices 38,010,670,666 times, and it removed 51,505 COVID-19 misinformation videos (TikTok; TikTok; TikTok). It launched #LearnOnTikTok in Europe with €13 million (TikTok Newsroom).
What does the FDA require in drug ads on TV?
A "major statement" of side effects in both audio and on-screen text. FDA's final rule on the major statement in direct-to-consumer TV and radio ads took effect on May 20, 2024 (FDA, Federal Register), more than 14 years after it was proposed on March 29, 2010 (FDA). The rule, 21 CFR 202.1(e)(1)(ii)(C), requires dual modality, text and audio together (eCFR); FDA declined a proposal that the text fill at least 7 percent of the screen (FDA). In its 2023 final rule, FDA estimated it would cover about 570 TV ads a year at a 10-year cost of $218.3 million, $31.1 million a year (FDA; FDA; FDA). Drug makers submitted 564 new TV ads to FDA in 2020, up from 434 in 2007, and 56 radio ads (FDA; FDA; FDA). FDA, quoting outside data, put 2020 prescription-drug TV ad spending at $4.58 billion (FDA).
Enforcement had all but stopped: FDA says its advertising warning letters fell to one in 2023 and zero in 2024 (FDA). On September 9, 2025 it said it was sending thousands of letters telling drug companies to remove misleading ads, plus about 100 cease-and-desist letters (FDA), and starting rulemaking on the "adequate provision" route for broadcast ads created in 1997 (FDA); we found no proposed rule in the Federal Register by October 31, 2026. The maximum civil penalty for a false or misleading drug ad is $377,701 for a first violation in three years (HHS, 45 CFR 102.3).
What privacy rules apply to health video and telehealth?
HIPAA for providers, the FTC's rule for health apps. HIPAA's inflation-adjusted penalties (2025 adjustment) run from $145 per violation where the provider did not know (HHS) to $73,011 per violation at the lower tiers and $73,011 minimum for uncorrected willful neglect, with a calendar-year cap of $2,190,294 per provision (HHS; HHS; HHS); HHS's 2019 enforcement notice set lower annual caps, from $25,000 (HHS). The pandemic leniency for telehealth on consumer video apps ended with a transition period on August 9, 2023 (HHS). On June 20, 2024 a federal court vacated the part of HHS's online tracking guidance that covered public web pages (HHS). A breach affecting more than 500 residents of a state must be reported to the media (eCFR), and patients must be told within 60 calendar days (eCFR); smaller breaches can be logged and reported within 60 days of year end (eCFR).
The FTC's Health Breach Notification Rule, amended to cover health apps from July 29, 2024 after about 120 comments (FTC, Federal Register; FTC), has the same 60 calendar days deadline and 500-resident media threshold (eCFR; eCFR), a 90 days web notice when contact details are out of date (eCFR), and penalties of up to $53,088 per violation (January 2025 adjustment) (eCFR). Its first two cases, both in 2023, fined GoodRx $1.5 million and the Premom app's maker $100,000 for sharing health data with advertisers (FTC; FTC).
How big is U.S. healthcare, and who markets it?
U.S. health spending reached $5.3 trillion in 2024, $15,474 per person and 18.0% of GDP, according to CMS (CMS; CMS; CMS). Hospitals took $1,634.7 billion and physician and clinical services $1,109.7 billion (CMS; CMS). CMS actuaries project health spending at 20.6 percent of GDP by 2034 (CMS).
The American Hospital Association counts 6,100 U.S. hospitals, 5,121 of them community hospitals, 1,224 investor-owned, and 3,567 in a health system, with 35,658,583 admissions in its 2024 survey (AHA; AHA; AHA; AHA; AHA). The Census Bureau counted 7,523 hospital establishments in 2023 (Census CBP); the two programs define a hospital differently, so the counts do not match. The largest for-profit operators report their own: HCA 190 hospitals with 2,297,065 admissions in 2025, Tenet 50, Community Health Systems 69, and Universal Health Services 375 inpatient facilities (HCA 10-K; HCA 10-K; Tenet 10-K; CHS 10-K; UHS 10-K).
How many healthcare employers and workers are there?
BLS's Quarterly Census of Employment and Wages counted 2,080,080 private health care and social assistance establishments in 2025, employing 22,997,661 people, up from 20,184,056 in 2019 (BLS QCEW; BLS QCEW; BLS QCEW). That includes 243,538 physician offices with 2,991,640 workers, 137,612 dentist offices, 38,952 chiropractor offices, and private hospitals employing 5,572,896 (BLS; BLS; BLS; BLS; BLS).
U.S. healthcare occupations, May 2025 (BLS Occupational Employment and Wage Statistics, wage and salary jobs)
BLS projects healthcare support jobs to grow 13.3 percent from 2025 to 2035, the fastest of 22 major groups, and practitioner jobs 8.0 percent (BLS; BLS). Health care and social assistance is projected to add more than 2.2 million jobs, about 37.0 percent of all new U.S. jobs (BLS; BLS).
How many marketing people work in hospitals?
Few, for the size of the workforce. Hospitals employed 6,712,760 people in May 2025 (BLS), including 4,330 public relations specialists (median wage $80,350), 3,050 marketing managers ($137,070), 5,420 marketing specialists and 620 graphic designers (BLS; BLS; BLS; BLS; BLS; BLS). That is about one PR specialist per 1,550 hospital workers. BLS publishes no estimate for film and video editors employed by hospitals. Doctors' offices, clinics and other ambulatory care employed 7,260 PR specialists and 5,900 marketing managers (BLS; BLS).
What do telehealth companies spend on advertising?
Their 10-K filings say. Teladoc Health spent $545.7 million on advertising in 2025 and completed 17.1 million visits, about $31.9 of advertising per visit (Teladoc 10-K; Teladoc 10-K). Hims & Hers spent $814.9 million on advertising and content production and ended 2025 with 2,511,000 subscribers, about $325 per subscriber (Hims & Hers 10-K; Hims & Hers 10-K). Amwell's platform handled 4,535,000 visits in 2025, down from 5,905,000 in 2024, on advertising of $1,860 thousand (Amwell 10-K; Amwell 10-K). Doximity says its members are more than 85% of U.S. physicians; its fiscal 2026 revenue of $644,863 thousand came mostly from drug makers and health systems marketing to doctors (Doximity 10-K; Doximity 10-K).
What the popular healthcare video numbers really say
Hospital-marketing and medical-video blogs repeat a small set of figures. We traced each to the organization that first published it, using exact-phrase searches for the figure and its older wordings, Internet Archive captures, Google's own blogs and trade press of the period. Several began as a narrower measurement than the one now quoted; some have no origin we could find.
"7% of Google searches are health-related" and "a billion health questions a day"
Neither figure appears in anything Google published. Agency pages state that 7% of Google searches are health-related and that there are 70,000 health searches a minute (WebFX; WebFX); others pair 7% with "roughly 1 billion per day" (7%, Revenue Memo) or credit it to Google's David Feinberg in 2019 (7%, Sagapixel). The earliest source is a Telegraph article of March 10, 2019 that paraphrases Feinberg at a conference: "around 7 per cent of Google's daily searches," equal to 70,000 a minute, and "more than one billion health questions each day" (The Telegraph; The Telegraph). The two numbers in that article disagree: 70,000 a minute is about 100.8 million a day, a tenth of a billion. WebFX's "100 billion healthcare searches a year" has no source at all (WebFX, repeat only).
Google's own words are vaguer. Its 2015 health knowledge-panel post said "one in 20" Google searches are for health information, which is where the "5%" lines come from (Google; repeated undated as 5% by Invoca). In 2016 it said roughly 1 percent of searches are about symptoms (Google). In March 2023 its Chief Health Officer wrote that people ask Google health questions "hundreds of millions of times a day," and that YouTube health-condition videos were viewed more than 110 billion times in 2021 (Google; Google). The "one billion a day" returned in March 2026, in PPC Land's account of a Google keynote (One billion, PPC Land), not in anything Google posted. Use instead: Google's "one in 20" (2015) or "hundreds of millions of times a day" (2023), with the year.
"30% of patients who watch a hospital video book an appointment"
This is from a 2012 Google and Compete study of 533 people already researching hospitals online, surveyed in May and June 2012, plus browsing data for 12 hospital brands (Google / Think with Google). Only 1 in 8 respondents, roughly 65 people, watched any online video, most often on hospital sites (Google); of those, 30% booked an appointment (Google), roughly 20 people. That is about 3.75% of all respondents, and the study gave no booking rate for people who did not watch, so it shows no effect of video. 53% of non-watchers did not know hospital videos existed, YouTube traffic to hospital sites had grown 119% in a year, and 77% searched before booking (Google; Google; Google). Its "nearly 3x" more visitors from search, also worded as "three times" more, and the 3x more searches by bookers describe search, not video (Google, archived; Google, archived; Google).
Repeaters drop the 2012 date and the one-in-eight base: 119% and 30% at Insight Forums, "three times" at Healthcare Success, 30% as "the strongest healthcare-specific benchmark available" at Blare Video, 3x at Invoca and 77% at Sagapixel (Insight Forums; Insight Forums; Healthcare Success; Blare Video; Invoca; Sagapixel). Use instead: current survey data, such as HINTS' 59.6% of adults watching health videos on social media in 2022.
"Video before a procedure cuts anxiety by 31%"
We found no trial or meta-analysis behind it. A 3D medical animation studio says procedure videos "decrease pre-operative anxiety scores by 31%" with no source (Chasing Illusions, repeat only), and another agency cites "a 2025 randomized controlled study of 200 patients" it does not name (MediaFurrate, repeat only). The percentages that do circulate come from small or non-comparable studies: a Spanish cataract trial reporting "a 30% reduction in anxiety" with no control comparison in its abstract (Pielęgniarstwo Chirurgiczne); a 2014 conference abstract of 49 patients who wore video glasses showing entertainment during the procedure, 18.1% less anxious after than before against 7.5% (MDedge report); and a Mayo Clinic trial of 53 joint-replacement patients that Fierce Healthcare headlined as cutting anxiety (Fierce Healthcare, archived), when the median anxiety score moved by 1 point and no result was statistically significant (Interactive Journal of Medical Research). Use instead: the reviews in the anxiety table above, which find clear effects for colonoscopy and children and little or none for adult surgery and consent.
"33% turn to YouTube before their doctor" and "84.7% make health decisions from YouTube"
Both are real surveys with narrower samples than the repeats suggest. WebFX's 33% (WebFX) comes from CharityRx, a prescription discount card company, which in September 2022 commissioned a Pollfish survey of 2,000 adults exposed to drug or supplement ads (CharityRx): 33% turned to YouTube first and 65% to Google first; the release does not say whether respondents could pick more than one (CharityRx; CharityRx). The 87.6% and 84.7% figures (MediaFurrate) come from a 2024 BMC Public Health study of 3000 regular YouTube users recruited on a paid online panel (BMC Public Health): 87.6 percent watched health content, 84.7 percent made decisions based on it and 40 percent used it to decide whether to see a doctor (BMC Public Health; BMC Public Health; BMC Public Health). It describes YouTube users, not patients.
"94% of patients use online reviews" and "patients will switch for telehealth"
Invoca's "94% of healthcare patients use online reviews to evaluate providers," credited to Software Advice (Invoca, repeat only), is not in Software Advice's report. Its 2020 survey, narrowed from 854 patients to 498 with relevant experience, found 90% used reviews to evaluate physicians and 71% used them as the first step (Software Advice; Software Advice; Software Advice), up from 25% in 2013 (Software Advice). Software Advice is owned by Gartner and sells software to medical practices.
The "20 percent would switch to a video-enabled provider" line (Healthcare Success) traces to American Well's 2017 consumer survey: 20 percent would switch primary care doctors for one who offered telehealth, from Harris Poll samples of 2,100 and 2,007 adults in 2016 (American Well; American Well). A 2021 Harris Poll for NextGen Healthcare, of 2,055 adults, found 48 percent would switch if their provider did not offer telehealth (NextGen; NextGen). Both companies sell telehealth software.
"Healthcare videos get 1,200% more shares"
It has no healthcare origin. Medical-video vendors say healthcare video gets 1,200% more shares than text and images combined (Chasing Illusions; WifiTalents, repeats only). The number is a 2012 finding by the agency M Booth and Simply Measured, reported by Adweek, that brands' Facebook videos were shared 12 times more than links and text posts combined (Adweek); our real estate and nonprofit pages trace the same line.
"70% of hospitals use video"
We found no source for it and no current page that still states it. The nearest measured figure is a 2013 academic count of hospitals with a YouTube channel in 2012, which we could not open at its publisher. Our own read is the closest current figure: 87.3% of the largest nonprofit hospitals' homepages link to YouTube, but only 21.0% show video on the homepage.
We started from the questions people search for about healthcare video statistics and looked for the organization that actually produced each answer. Every figure on this page sits in an evidence ledger with its source, the exact table or paragraph it came from, the measurement period, the population measured, and the date we checked it. This edition holds 378 figures from 88 publishers.
On October 31, 2026, each of the sourced figures on this page was re-fetched with the fetch cache cleared and matched against the recorded wording: BLS wage and employment figures through the BLS data API and QCEW open data, SEC filings from EDGAR, journal articles at PubMed and PubMed Central, and pages that refuse scripts (cdc.gov, bls.gov, hhs.gov, pewresearch.org, softwareadvice.com) through dated Internet Archive captures; five PubMed Central pages that showed a bot check to the script were matched in a headless browser. Our own figures come from the IRS Business Master File and the hospitals' e-filed Form 990s, a headless-browser read of 200 hospital homepages on October 31, 2026, and a YouTube Data API read of the channels they link to; the per-hospital data is published in hospitals.csv and youtube-uploads.csv. We left out a 2026 JAMA research letter still under embargo at PubMed Central, a KFF topline file that refused our requests, and a 2013 count of hospital YouTube channels we could not open at its publisher.
We only cite the producer: government agencies, regulators, company filings and official posts, and the survey owner's own report. We do not cite statistics roundups, Statista-style aggregators, or salary sites without a public method. We did not bypass paywalls or sign-up forms; where a full report was gated, we used only the figures its publisher states publicly.
Figures marked "our calculation" are arithmetic on the cited numbers, and anyone can reproduce them:
This edition contains no Mark Studios customer data.
Limitations
Our hospital sample is the biggest nonprofit filers, read once. The 200 are the largest 501(c)(3) hospital organizations by Form 990 revenue, one per website, so for-profit, government and VA hospitals are not in it, and a system that files under one parent counts once. 17 homepages refused a headless browser and 2 failed to load; they are left out, not guessed. Homepages change often.
Our label rules are mechanical. A virtual-care link is a link or button whose label mentions virtual care, a virtual or video visit, telehealth or telemedicine; links hidden in menus count as present but not as visible in the first screen. Icon-only buttons are missed, so the shares are floors.
Telehealth counts are not comparable across sources. NCHS asks about the past 12 months, Household Pulse about four weeks, CMS counts beneficiaries who had a telehealth-eligible service, FAIR Health counts claim lines and patients with a claim, and most count phone calls as telehealth. The page keeps them apart.
The newest national figures are old. NCHS has not published adult telemedicine use after 2022, Household Pulse stopped asking about telehealth in August 2022, and the last national health literacy measurement is from 2003.
Several figures come from parties with a stake. Google, YouTube and TikTok report on their own platforms; Software Advice, American Well, NextGen, CharityRx and the video vendors in the myths section sell into healthcare; the AMA, an association of physicians, reports its own surveys of physicians.
Trials are small and specific. Most patient-education video trials enrol a few hundred patients for one procedure in one country, and their anxiety and knowledge scales differ, which is why the page shows them side by side instead of pooling them.
How to cite this page
For a single figure, cite the original publisher named next to it, and link here if the verification trail is useful to your readers. Each figure has its own anchor, so you can link straight to it, for example https://www.markstudios.com/research/healthcare-video-statistics#DRV-004. To cite the page as a whole:
Mark Studios. "Healthcare Video Statistics." Last verified Oct 31, 2026. https://www.markstudios.com/research/healthcare-video-statistics
APA
Mark Studios. (2026, October 31). Healthcare video statistics. https://www.markstudios.com/research/healthcare-video-statistics
MLA
“Healthcare Video Statistics.” Mark Studios, 31 Oct. 2026, www.markstudios.com/research/healthcare-video-statistics.
Chicago
Mark Studios. “Healthcare Video Statistics.” Last modified October 31, 2026. https://www.markstudios.com/research/healthcare-video-statistics.
BibTeX
@misc{markstudios_healthcare_video_statistics_2026,
  author = {{Mark Studios}},
  title = {{Healthcare Video Statistics}},
  year = {2026},
  month = oct,
  url = {https://www.markstudios.com/research/healthcare-video-statistics},
  note = {Last verified 2026-10-31}
}
Our calculations and the evidence table are free to reuse with attribution and a link to this page. Each underlying figure remains the claim of its original publisher, and some publishers ask for a link when their figures are reused.
We re-verify every figure quarterly and when a major source publishes a new edition. The next scheduled review is January 2027. Corrections go to contact@markstudios.com.
Oct 31, 2026: First published with 378 figures from 88 publishers, each checked against its original source.
Oct 31, 2026: Corrected the same day: FDA's major-statement rule took effect more than 14 years after its March 2010 proposal, not 13; in the 2012 Google/Compete study about 65 respondents watched video and about 20 of them booked, where the page had put 65 against the bookers; FDA's roughly 100 cease-and-desist letters of September 2025 came on top of its thousands of letters, not among them; rural Medicare beneficiaries have used telehealth less than urban ones in every year since 2020 (39.81% against 50.40% that year), so 2025 is not a reversal; CharityRx's 33% and 65% add up to 98%, not more than 100%; and the AMA's practice survey samples physicians nationally, not only its members.
Frequently asked questions
How many hospitals use video on their website?
Fewer than you might expect. On October 31, 2026, 21.0% of the homepages of the 200 largest U.S. nonprofit hospitals that we could read showed a video, and 12.2% embedded a click-to-play player. 87.3% linked to YouTube, so most keep their video on YouTube rather than the homepage.
How many people use telehealth?
The CDC's National Health Interview Survey found 30.1% of U.S. adults had a telemedicine visit in the past 12 months in 2022, down from 37.0% in 2021. Among Medicare fee-for-service beneficiaries with a telehealth-eligible service, 23.25% used telehealth in 2025. In commercial insurance, 18.3% of patients with a claim had a telehealth claim in Q2 2026, according to FAIR Health.
Are most telehealth visits by video or by phone?
For all adults, slightly more by video: more than half of adult telehealth users had a video visit in every Household Pulse wave from July 2021 to August 2022. Older adults lean on the phone; adults 65 and over did 56.5% of their telehealth visits by audio only.
How many people watch health videos on YouTube?
59% of Americans watched a health-related video on YouTube in the past 12 months in 2022, according to the National Cancer Institute's HINTS survey. A separate analysis of the same survey found 59.6% watched health videos on any social media, up from 30.1% in 2017.
Do patient-education videos reduce anxiety before a procedure?
It depends on the procedure. A network meta-analysis of colonoscopy trials found a large reduction (SMD -1.47) and one of children before surgery found SMD -1.08, but the Cochrane review of consent interventions found no significant effect on anxiety (SMD -0.11), and a review of adult surgery found anxiety unchanged in 10 out of 14 multimedia comparisons. Knowledge gains are more consistent.
How many Google searches are health-related?
Google's own figure is one in 20 searches (2015), and in 2023 it said people ask health questions hundreds of millions of times a day. The widely repeated 7% comes from a 2019 Telegraph article paraphrasing a Google executive, not from anything Google published.
What does YouTube require to label a channel as a health source?
A licensed professional's or health organization's channel needs more than 1,500 valid public watch hours in the past 12 months, or 1.5 million Shorts views in 90 days, and must pass YouTube's review, which it says takes about 1-2 months.