Every figure on this page links to the organization that produced it, and each was re-checked against that source before publishing. What the 200 biggest U.S. fundraising charities do with video on their websites (our own measurement from IRS filings), how much Americans give and how much of it online, what nonprofits get back from email, ads and social media, what controlled tests show about video and donations, what YouTube, Meta, GoFundMe and charity livestreams report, who gives and whether they trust charities, how big the sector is, and where the popular nonprofit video numbers came from.
31.9% of the 185 big-charity homepages we read showed video, about the same as the 31% of the most-visited websites in our homepage video study. (Our measurement)See details
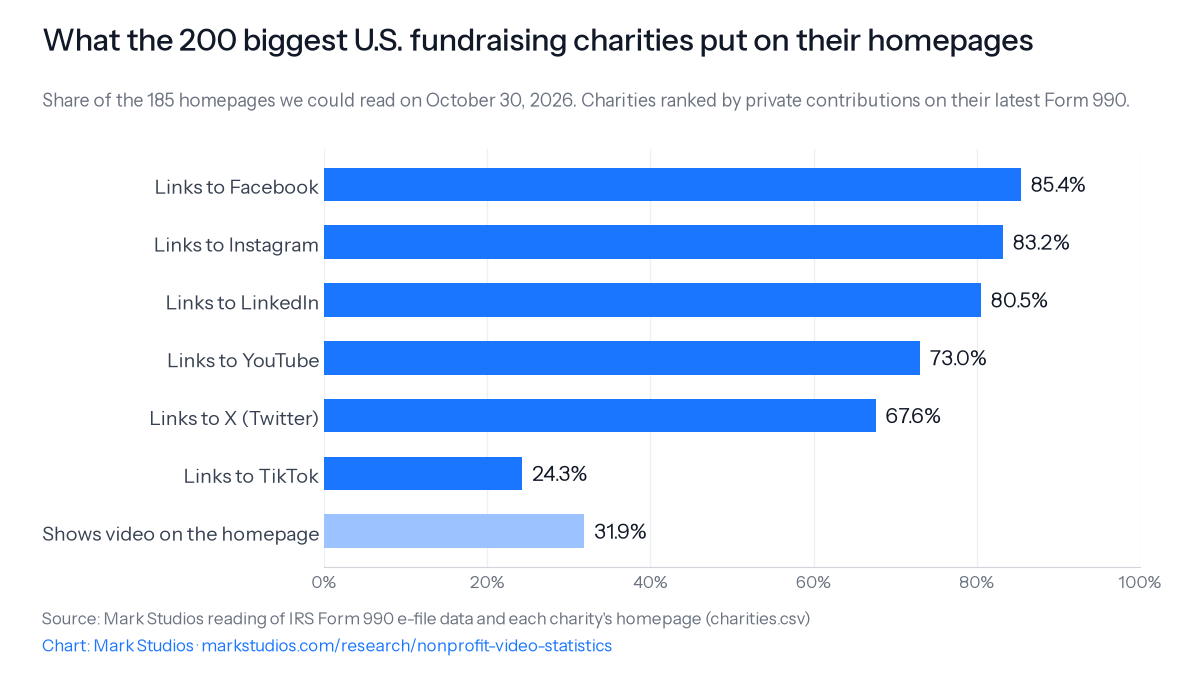
73.0% of those homepages linked to YouTube and 24.3% to TikTok; 88 linked to YouTube but showed no video on the homepage itself. (Our measurement)See details
42.4% of the big-charity homepages with video played a muted background loop with no controls, not a film to watch. (Our measurement)See details
The median big charity reported 2.6 cents of fundraising expenses per dollar of private contributions on Form 990, or 7.7 cents per cash dollar. (Our calculation from IRS Form 990 data)See details
Americans gave an estimated $617.20 billion to charity in 2025, 3.0% more than in 2024 after inflation. (Giving USA Foundation)See details
Dollars given rose 5.0% in 2025 while the number of donors fell 3.6%, extending a decline in donors that began in 2021. (Fundraising Effectiveness Project)See details
Online giving was over 12% of all giving at the average U.S. nonprofit in 2023. (Blackbaud Institute, research arm of a fundraising-software company)See details
Paid search ads returned $2.48 per $1 spent for nonprofits in M+R's study in 2025; digital video ads returned $0.56. (M+R Benchmarks 2026)See details
In published A/B tests on donation pages, video cut conversion 20.9% at Hillsdale College, the same appeal as text converted 527.5% better at e3 Partners, and across 14 organizations and about 26,000 visitors video made no significant difference. (NextAfter; Fundraise Up)See details
A randomized Facebook video-ad campaign for Save the Children in Germany raised 17.65 euros a day per million inhabitants and returned 1.45 euros per euro spent, against no ads. (Adena and Hager)See details
The popular '57% of people who watch a nonprofit video donate' comes from a 2013 Google survey of 982 people who had already researched a nonprofit, who said they gave after watching a video. (Google with Millward Brown Digital, 2013)See details
How do the largest U.S. charities use video on their websites?
About a third put video on the homepage, the same share as the web's most-visited sites, and nearly three-quarters link to a YouTube channel. Of the 185 big-charity homepages we could read on October 30, 2026, 31.9% showed video somewhere on the page and 73.0% linked to YouTube. In our homepage video study, read the same way, 31% of the most-visited websites' homepages showed video.
The sample is mechanical and comes from IRS data. We took every 501(c)(3) public charity in the IRS Exempt Organizations Business Master File (downloaded October 30, 2026) classed as publicly supported (foundation codes 15 and 16), read each one's latest e-filed Form 990 from the IRS's 2024-2026 e-file releases, and ranked them by private contributions: total contributions minus government grants. We left out donor-advised fund sponsors (charities whose contributions into donor-advised funds were more than half their private contributions, on Schedule D) and kept one charity per website. That gives the 200 charities that raised the most from private donors, from Feeding America and St. Jude's fundraising arm, ALSAC, down to $136.3 million a year. Together they reported $78.68 billion in private contributions, 34.7% of it in noncash gifts such as donated food and medicine. Each homepage is the website the charity gave on its Form 990, opened in a desktop browser, scrolled to load lazy players and checked with the same rules as the homepage study. 185 of the 200 loaded; the rest answered with a bot check or an error. The full list, with every Form 990 figure and homepage result, is public: charities.csv.
Where the 200 biggest U.S. fundraising charities link from their homepages (185 homepages read, Oct 30, 2026; our measurement)
What the 200 biggest U.S. fundraising charities put on their homepagesShare of the 185 homepages we could read on October 30, 2026. Charities ranked by private contributions on their latest Form 990. Light bar: a video player or video file at least 150 by 80 pixels anywhere on the homepage.
The YouTube share matches what the M+R Benchmarks Study's mostly national nonprofits report, 74% with a YouTube presence; TikTok trails far behind on charity homepages, at about a quarter. Linking to a channel is not the same as using video to make the case: 88 of the homepages linked to YouTube but showed no video on the homepage itself. Where there was video, it was often decoration. On 59.3% of the homepages with video, a video started within the first 900 pixels a desktop visitor sees before scrolling, and 42.4% played a muted, autoplaying loop with no player controls rather than a film to watch. 22 of the 59 embedded a YouTube player and 12 a Vimeo player. 87.6% of the homepages had a link or button labelled donate or give.
What the biggest charities spend to raise a dollar
Very little, as they report it. The median charity among the 200 reported 2.6 cents of fundraising expenses per dollar of private contributions on its Form 990; counting cash gifts only, it was 7.7 cents. 19 of the 200 reported no fundraising expenses at all. Together the 200 reported $4.20 billion in fundraising expenses and $779.7 million in advertising and promotion; for the median charity that reported advertising, it was 0.48% of total expenses. Form 990 leaves the split between fundraising, programs and administration to each charity, and costs shared between an appeal and a program, such as a campaign film that also educates, are allocated by the charity itself.
How much do Americans give to charity?
An estimated $617.20 billion in 2025, according to Giving USA's annual estimate of giving by individuals, bequests, foundations and corporations combined Giving USA Foundation. That was 5.7% more than in 2024 in current dollars Giving USA Foundation and 3.0% more after inflation Giving USA Foundation. Giving USA revises each year's figure in the next edition, so its first estimate for 2024, $592.50 billionGiving USA Foundation, should not be subtracted from the 2025 figure; use the growth rate instead.
U.S. charitable giving by source, 2025 (Giving USA 2026 estimates, current dollars)
Dollars rise while the number of donors falls. The Fundraising Effectiveness Project, which tracks gifts recorded in nonprofits' donor databases, found dollars up an estimated 5.0% in 2025 Fundraising Effectiveness Project while the number of donors fell 3.6%, extending declines that began in 2021 Fundraising Effectiveness Project. The pattern held in the first half of 2026: dollars up 6.6%FEP, donors down 1.6%FEP. In 2024 donors fell 4.5%FEP as dollars rose 3.5%FEP.
The money is concentrated. In the first half of 2026, major and "supersize" donors gave 76.4% of all dollars in the FEP panel while making up 2.9% of donors FEP. Micro donors giving $1 to $100 were 51.6% of donors and the only group to shrink in both donors and dollars FEP.
Keeping a donor is the hard part. Overall donor retention in the FEP panel was 43.3% in 2025 FEP, and only 18.9% of first-time 2024 donors gave to the same organization again in 2025 FEP. Donors who gave seven or more times in 2025 were retained at 90% in the first half of 2026, against 14.4% of one-time donors FEP. FEP's mid-year retention, 26.4% by the end of June 2026 FEP, counts only half a year and cannot be set beside the full-year rate; just 11.3% of donors acquired in 2025 had given a second time by then FEP. The panel leaves out gifts made through donor-advised funds and payment apps.
Donor-advised funds and tax returns
Donor-advised funds, accounts held at a sponsoring charity from which donors recommend grants, granted $64.60 billion to charities in fiscal 2024 DAF Research Collaborative and took in $90.57 billionDAF Research Collaborative. Donors at Fidelity Charitable, the largest sponsor, recommended a record $18.3 billion in grants in 2025, by the sponsor's own count Fidelity Charitable. DAF grants overlap with Giving USA's individual giving; the two should not be added.
Most gifts no longer show up on tax returns. For tax year 2023, 11,747,949 individual returns reported gifts to charity on Schedule A, the itemized-deduction form IRS Statistics of Income, totalling 211,975,123 thousand dollars, about $212 billion IRS Statistics of Income. For tax year 2022, 12,180 thousand returns claimed the deduction IRS Statistics of Income, worth 222,385 million dollars after the income limits IRS Statistics of Income. Only taxpayers who itemize deductions appear in these counts.
How much charitable giving happens online?
About one dollar in eight at the typical nonprofit. Blackbaud Institute, the research arm of a fundraising-software company, found online giving was over 12% of all giving at the average U.S. nonprofit in its index in 2023, up from almost 8% in 2022 under a changed method Blackbaud Institute; small nonprofits with revenue under $1 million received nearly 17% of their donations online Blackbaud Institute. Under its earlier method the online share was 12% in 2021 Blackbaud Institute. Online is the fast-growing part: Blackbaud puts growth in online giving at the typical nonprofit at about 11% in 2025 Blackbaud Institute, against total revenue growth of about 4.3%Blackbaud Institute. Blackbaud's figures describe a weighted typical organization among its customers, not the sector's dollars.
The 180 nonprofits in the M+R Benchmarks Study, mostly large national organizations, saw median online revenue rise 15% from 2024 to 2025 M+R, after 2% in 2024 M+R. One-time online gifts rose 17%M+R and monthly gifts 12%M+R; monthly giving was 27% of online revenue in 2025 M+R, down from 31% in 2024 M+R. M+R is a digital agency that sells fundraising services to nonprofits, and 180 organizations contributed data to its 2026 edition M+R, against 216 the year before M+R.
Online gifts and the phone
Half of the traffic, a smaller share of the money. Phones and tablets made 52% of visits to M+R participants' websites in 2025 M+R and 43% of donation transactions, but only 28% of online revenue M+R: the average gift made on a mobile device was $88M+R, against $168 on a desktop M+R. 11% of desktop visitors to a main donation page completed a gift M+R and 8% of mobile visitors M+R; across whole websites, 1.6% of visitors donated M+R. At Fundraise Up, a donation-checkout vendor, mobile devices made 51.1% of donations it processed for U.S. nonprofits in 2025 Fundraise Up, and its own "conversion to donate" measure was 26.7%Fundraise Up, a different denominator from M+R's page visitors. Blackbaud's latest free mobile figure is from 2021: 28% of online donations Blackbaud Institute.
Blackbaud puts the mean online gift at $197 in 2024 Blackbaud Institute and the median online gift in December 2025 at about $364Blackbaud Institute, a year-end month with large gifts.
GivingTuesday
Americans gave an estimated $4.0 billion on GivingTuesday 2025, December 2, 13% more than in 2024 GivingTuesday, when the day raised $3.6 billionGivingTuesday. An estimated 38.1 million people took part by giving money, goods or time or by speaking out GivingTuesday, and 19.1 million gave money GivingTuesday. Donors who gave on GivingTuesday 2024 were more likely to give again: 65% gave in 2025, against 52% of all donors Blackbaud Institute and GivingTuesday.
How donors say they give
Websites lead the online routes. In a December 2025 survey by BBB Wise Giving Alliance (Give.org), 33% of U.S. adults said they had donated through a charity's website in 2025 Give.org, 12% in response to a social media appeal Give.org, 8% through a crowdfunding site Give.org and 6% by text message Give.org. 15% responded to a mailed appeal and 14% to an email Give.org. In England, the government's Community Life Survey found 17% of adults gave online in the four weeks before they were asked in 2024/25, the same share as gave into collection tins DCMS, and 23% by direct debit DCMS.
A different weekly survey finds a giving habit that annual figures miss: 39.2% of U.S. adults in GivingTuesday's GivingPulse said they had given money in the past week in 2025 GivingTuesday GivingPulse, with a median weekly gift of $50GivingPulse. Of those who gave, 81% gave to registered charities and 60% to informal groups or individuals GivingPulse. GivingPulse is an online quota sample, not a probability survey.
What do nonprofits get back from email, ads and social media?
Email still raises money; most paid social and video ads lose it. M+R's 2026 Benchmarks Study found participants raised $54 for every 1,000 fundraising emails in 2025, up 4% M+R, from a median response rate of 0.05%M+R. The previous edition, drawn from a different group of 216 participants, put 2024 at $58M+R, so the two editions' figures can't be subtracted to measure the change; M+R's own comparison is the 4% rise. Open rates are no longer a usable measure: among participants that could tell them apart, 64% of email opens in 2024 were machine opens by privacy software M+R.
Participants spent $0.10 on digital ads for every dollar they raised online in 2025 M+R, 58% of it on direct fundraising M+R, and they cut spending on digital video ads by 5%M+R. The return depends on the channel.
Return on digital fundraising ad spend, M+R Benchmarks participants, 2025
Video ads may still build an audience that gives later through other channels; M+R's figure counts the revenue it could attribute to the ads. Google offers qualifying nonprofits up to $10,000 a month in free search ads through Google Ad Grants Google and says it has given over $10 billion in such ads since 2003 Google, to over 115,000 nonprofits Google in 51 countries Google. Google for Nonprofits, the gateway to Ad Grants and the YouTube Nonprofit Program, is available in 180+ countries and territories Google.
Which social platforms nonprofits use
Big nonprofits are on YouTube; small ones much less. 74% of M+R participants had a YouTube presence in 2025 M+R and 43% were on TikTok M+R. The typical participant had 2k YouTube followers, against 53k on Facebook and 18k on Instagram M+R. M+R's 2026 report gives two figures for TikTok follower growth, 34% in its key findings M+R key findings and 37% in the social media chapter M+R social chapter; we print both. 58% of participants worked with outside social media influencers at least once in 2025 M+R.
Nonprofit Tech for Good's survey reaches far more and far smaller organizations worldwide. In its 2023 report, from fieldwork in 2021 and 2022, 44% of nonprofits used YouTube and 6% TikTok Nonprofit Tech for Good; 53% paid for social media ads Nonprofit Tech for Good, but only 8% of those bought YouTube ads Nonprofit Tech for Good, and 4% used YouTube's fundraising tools Nonprofit Tech for Good. Its 2026 report, as quoted on its own site, puts TikTok use at 14%Nonprofit Tech for Good. Few use AI for video: 1% of nonprofits used an AI tool to create and publish video in that report Nonprofit Tech for Good, and among M+R participants using generative AI in 2024, 5% used it for video M+R.
Donors rank video platforms low as a source of news. In Nonprofit Tech for Good's 2024 survey of 641 online donors, 33% said email was the communication most likely to make them give and 29% named social media Nonprofit Tech for Good, but only 4% named YouTube as the social platform most useful for following their favourite nonprofits, against 34% for Facebook Nonprofit Tech for Good.
What a social-media donor is worth
Fundraise Up, drawing on donations to more than 1,000 of the nonprofits that use its checkout, found donors arriving from social media gave a first gift of $14.40 on average for U.S. nonprofits in 2025, against $71 for donors from search Fundraise Up. Donors arriving from TikTok signed up for recurring gifts at 18.7%, the highest rate of any social network Fundraise Up. Recurring donors are the ones who stay: Neon One, a donor-database vendor, found them retained at 79.11% in 2025 across 4,107 nonprofits Neon One, against 32.41% for one-time donors Neon One; its customers grew their recurring donor base 31.58% from 2023 to 2025 while their supporter base shrank Neon One. M+R puts retention of online one-time donors at 48%M+R.
Does adding video raise more money?
Not reliably. The controlled tests we found on donation pages and appeal emails mostly show video lowering or failing to change giving; the positive results come from ad campaigns against no campaign at all, from stories rather than video as such, or from platforms that publish no method. The table puts them side by side with what each one actually compared.
What controlled tests and platform claims say about video and giving
Source
What was compared
Result
NextAfter for Hillsdale College, June 2020 NextAfter
Donation page with a video vs the same page without; 1,514 visitors
Video cut conversion by 20.9%, and by 37.5% on phones NextAfter
Embedded YouTube video vs a static image on 14 organizations' donation pages; about 26,000 visitors
No statistically significant change in conversion or revenue per visitor
Adena and Hager, Save the Children Germany, Nov 2017 Adena and Hager
Facebook video ads in randomly chosen postal codes vs no ads
+17.65 euros a day per million inhabitants; 1.45 euros back per euro of ad spend immediately Adena and Hager, 2.53 if each new gift is assumed to be worth 1.75 times its value over time Adena and Hager
Fundraising pages with pictures and videos vs without; no basis given
"23% more"
NextAfter, a fundraising consultancy that publishes its clients' A/B tests, splits live traffic on one organization's page, so each result applies to that page and audience. The pattern across its tests is consistent, though: when the same message is offered as a video or as words on the donation page, the words raise more. Fundraise Up, which sells donation software and lets nonprofits add video, ran its test across 14 organizations and found no significant gain in any key measure; it published no conversion rates.
Video ads can still pay. In the one large randomized field experiment we found, Save the Children's two-week Facebook video campaign in Germany raised giving to the charity through every channel, in postal codes randomly chosen to see the ads, enough to return more than it cost. That compares video ads with no ads, not video with text, and the authors also found some gifts were drawn away from similar charities.
One child, not statistics
What moves donors in the lab is a single identifiable person, which a video can show but need not. In Small, Loewenstein and Slovic's 2007 experiments, people given a letter with a photo and the story of one girl, Rokia, gave a mean $2.38 of the $5 they had just earned Small, Loewenstein and Slovic, against $1.14 when given statistics about millions of hungry people Small, Loewenstein and Slovic; adding the statistics to Rokia's story cut giving to $1.43Small, Loewenstein and Slovic. The study used a printed letter, not video.
Crowdfunding and pitch videos
The best-known crowdfunding study is correlational. Ethan Mollick's analysis of 48,526 Kickstarter projects from 2009 to July 2012 found that, for projects with goals of $5,000 or more, not having a pitch video was associated with a 26% lower chance of reaching the goal for the mean project, holding goal, duration, category and featured status constant Mollick, Journal of Business Venturing. 86% of projects in his sample had a video Mollick, so a project without one was unusual, and the absence may stand for low effort generally. Indiegogo's own posts said campaigns with a pitch video raised 114% more, the average contribution was 12% higher Indiegogo, 79% of campaigns it featured had a video Indiegogo, successful fixed-funding campaigns with video raised 239% more Indiegogo and took 80% of the money Indiegogo, and 53% of campaigns that reached their goal had a video under three minutes Indiegogo. None of those posts gives a sample or method, and its help center was still repeating the 114% from the 2011 post in 2019 Indiegogo Education Center.
What do YouTube, Meta, GoFundMe and the streaming platforms report about giving?
Each platform publishes its own running totals, mostly as round "more than" figures with no year-by-year series. YouTube has never published a dollar total for YouTube Giving beyond saying in December 2020 that fundraisers had raised "millions of dollars", when it opened the tools to viewers in more than 40 countries Google. At its 2018 launch it said creators and fans could give to over 1M nonprofits YouTube. The YouTube Nonprofit Program itself is older: YouTube said over 16,000 nonprofits had joined by January 2012, five years after it began YouTube Official Blog, and its German blog counted more than 20.000 organizations in May 2013 YouTube Germany.
The rules for fundraising on YouTube
A creator needs at least 10k subscribers, membership in the YouTube Partner Program and a channel based in one of YouTube's available locations to run a YouTube Giving fundraiser, and the channel cannot be designated made for kids YouTube Help. YouTube says 100% of each donation goes to the nonprofit, with YouTube paying the transaction fees, and that the money is collected and passed on by Network for Good YouTube Help, which can take up to 2 monthsYouTube Help.
Meta, PayPal Giving Fund, GoFundMe and JustGiving
Running totals the giving platforms publish about themselves
Platform
Figure
Period
Facebook (Meta)
Over $1 billion raised through fundraisers and donate buttons Meta; over 20 million people had donated or started a fundraiser Meta
Over $8 Billion "for nonprofits and personal causes", worldwide Meta social impact page; a GoFundMe release says over $8 billion for nonprofits "in the U.S." GoFundMe
Through Oct 2024 (U.S.); through early 2025 (worldwide)
Most Facebook giving is peer to peer: Meta said over 80% of donations on Facebook in 2022 came from fundraisers people started and shared with friends and family Meta. Meta's donations reach charities through PayPal Giving Fund, which raised $952 million for 226,273 charities in 2024, the rise driven largely by U.S. charities funded through Facebook and Instagram PayPal Giving Fund. In 2023, when its Meta partnership expanded to the U.S., it raised more than $635 millionPayPal Giving Fund, and Meta and GoFundMe together generated 46% of its funds PayPal Giving Fund. GoFundMe published 2025 donation counts but no dollar total for the year.
Charity livestreams
Live video is where the largest single online fundraising events happen. Tiltify, a fundraising platform for creators, says creator-led campaigns on it, mostly livestreams, raised more than $100 million in 2025 Tiltify, 46% more than in 2024 Tiltify, from 1.2 million donors Tiltify. The #TeamWater campaign led by MrBeast and Mark Rober raised $41.7 million for WaterAid in 31 days Tiltify, $12 million of it in one 17-hour livestream Tiltify.
Charity streaming totals, as each organizer reports them
Event or program
Raised
Period
Awesome Games Done Quick 2026, for the Prevent Cancer Foundation
Over $75,000,000 for over 100 charities Twitch; a record $25.3 million in 2016 Twitch
2011 to July 2017
The Games Done Quick tracker totals run slightly above the totals announced when each marathon ended, because late donations keep posting; Extra Life's two pages give different totals at once. Extra Life had more than 15,000 participants in 2025 Extra Life. TikTok's only published total is from 2021: almost 75,000 donations to organizations and causes TikTok. Twitch has published no platform-wide figure since 2017.
The ALS Ice Bucket Challenge of 2014 remains the largest campaign built on people filming and sharing video. Facebook counted more than 17 million challenge videos shared between June and September 2014 Facebook, viewed by more than 440 million people Facebook, and the ALS Association says the campaign raised $115 millionALS Association.
How many Americans give, and do they trust charities?
Between half and three-quarters of adults, depending on what is counted. The answer moves with the question: whether religious and political gifts count, whether it is people or households, and whether the window is a year or a week.
Share of Americans who give, by survey and definition
U.S. adults who gave to a charity (not directly to people) in 2025
41%
The long trend is down. In 2000, 66.2% of U.S. households gave to charity, according to the Philanthropy Panel Study Lilly Family School of Philanthropy. The Lilly School's 2021 report put 2018 at 49.6%Lilly School, 2021 and its 2024 analysis, using a subset of the same panel, at 50.9%Lilly School, 2024; we print both. Gallup's December readings peaked at 87% in 2005 Gallup. AmeriCorps counts at least 121.8 million Americans 16 and older who gave more than $25 between September 2022 and September 2023 AmeriCorps, and 75.7 million who volunteered through an organization U.S. Census Bureau, 28.3% of that age group, up from 23.2% in 2021 U.S. Census Bureau. 18 percent of formal volunteers served at least partly online AmeriCorps, and 54.2% of people helped neighbors informally U.S. Census Bureau. By CAF's measure the average American gave 0.9% of income in 2025, 47th of 105 countries Charities Aid Foundation.
Crowdfunding
In a September 2020 Lilly School survey, 31.7% of U.S. adults said they typically give to crowdfunding projects Lilly Family School of Philanthropy and 91.5% knew what crowdfunding was Lilly Family School of Philanthropy; the study was funded by Facebook. Pew Research Center found 22% of adults had given to a crowdfunding project by late 2015 Pew Research Center.
Trust
Trust in nonprofits is middling and depends on the scale. Independent Sector found 56% of U.S. adults had high trust in nonprofits in April 2026, more than for any other institution it measured Independent Sector, after 57% in 2024 Independent Sector and 52% in 2023 Independent Sector. On a stricter scale, Give.org found only 18.3% reporting high trust in charities in December 2025 Give.org, while 67.7% said trusting a charity is essential before giving Give.org. CAF found 48% of Americans had high trust in national charities, against about six in ten for local charities and 28% for international ones CAF America. Worldwide, 58% of people across 28 countries trusted NGOs to do what is right in Edelman's 2026 Trust Barometer Edelman.
Donors say transparency would change what they give. 74% of U.S. adults told Independent Sector that transparency about how funds are used would raise their trust Independent Sector, and 60% of those who dealt with a nonprofit in the past year said it increased their trust Independent Sector. 61% told CAF America they would give more with clearer insight into impact CAF America. Among those who look things up before giving, 54% said charities' own websites influence them most, 39% third-party monitors and 7% AI summaries Give.org.
How many nonprofits are there, and how many people raise money for them?
The IRS recognized 1,596,231 organizations as tax-exempt under section 501(c)(3) in fiscal year 2025, a count that includes private foundations and many inactive groups IRS Data Book. Most are small: of the forms the IRS processed that year, 736,837 were the 990-N e-Postcard that the smallest organizations file IRS, 224,050 the short 990-EZ IRS, 373,765 the full Form 990 IRS and 129,748 the private foundation return, 990-PF IRS. Exempt organizations filed 1,798,413 returns and forms of all kinds IRS Data Book, and the IRS approved 121,913 new 501(c)(3) applications IRS Data Book. The Urban Institute counted about 1.54 million registered nonprofits of all types in 2016 Urban Institute.
For tax year 2019, the latest year with readable IRS totals, 304,231 charities filed a Form 990 or 990-EZ IRS Statistics of Income and reported $2.4 trillion in revenue IRS Statistics of Income.
Jobs and output
501(c)(3) nonprofits accounted for 12.8 million jobs in 2022 BLS, 9.9 percent of private-sector employment BLS, at over 300,000 establishments with employees BLS; 66.3 percent of those jobs were in health care and social assistance BLS. In 2017 the count was 12.5 millionBLS. The household survey, which counts people rather than jobs, puts 6.5 percent of employed people at private nonprofits in 2022 BLS. Nonprofit institutions serving households produced 1,643,559 million dollars of value added in 2025 BEA, 5.3% of the 30,861,292 million dollars of U.S. GDP BEA.
The Census Bureau's 2022 Economic Census counted 105,024 tax-exempt employer establishments in grantmaking, advocacy, civic, social, business and professional organizations (NAICS 813; the Economic Census does not cover religious organizations, labor unions or political organizations) U.S. Census Bureau, with 336,550,591 thousand dollars of revenue U.S. Census Bureau. Foundations, charitable trusts and fundraising federations (NAICS 8132) made up 21,654 of them U.S. Census Bureau, with 181,898,631 thousand dollars of revenue U.S. Census Bureau.
Fundraisers
Fundraising occupations in the United States (BLS)
The projections count 140.9 thousand fundraiser jobs in 2025 including the self-employed BLS Employment Projections, more than the employer survey's 111,040, with about 10.0 thousand openings a year BLS Employment Projections. The largest employers of fundraisers are religious, grantmaking, civic and professional organizations, 35,150 of them BLS OEWS, 17,990 in grantmaking and giving services alone BLS OEWS.
How do other countries compare?
Worldwide, 61% of people donated money in 2025, to charity, to people in need or for religious reasons, down from 64% in 2024 Charities Aid Foundation, according to the Charities Aid Foundation's surveys in 105 countries Charities Aid Foundation. Americans gave at about the world rate: 63% by any means, 41% to charities.
Registered charities and giving in four other jurisdictions, as each regulator reports them
$14.8 billion in donations and bequests ACNC, out of $239 billion in revenue ACNC
In the UK, giving is falling. CAF's UK Giving report found 55% of people gave to charity in 2025 Charities Aid Foundation, down from 69% in 2016 Charities Aid Foundation, and the public gave an estimated £14 billion, almost 10% less than in 2024 Charities Aid Foundation. The government's Community Life Survey, with a four-week window that includes charity shops and raffles, found 67% of adults in England had given in 2024/25 DCMS. Trust in charities in England and Wales has recovered: 57% had high trust in January 2026 Charity Commission, with a mean score of 6.5 out of 10, up from 5.5 in 2018 Charity Commission. Australian charities' donations fell from $18.9 billion in 2023, a year inflated by one $4.9 billion gift ACNC; figures are in Australian dollars and Canadian figures in Canadian dollars.
What the popular nonprofit video numbers really say
These figures recur in donation-software blogs, nonprofit video guides and agency pages. Each was traced to the organization that first published it. Most began as something narrower: a survey answer, a crowdfunding site's blog post, one company's landing-page test, or brands' Facebook pages.
"57% of people who watch a nonprofit video go on to donate"
This comes from Google's September 2013 study "Mission 501(c)(3): Driving Donations, Digitally", run with Millward Brown Digital. 57% of respondents said they had made a donation after watching an online video Google, Think with Google, but the respondents were 982 online panelists who had already researched a nonprofit in the previous 12 months, surveyed in May and June 2013 Google. It is a self-reported answer from people already looking into charities, not the share of video viewers who give. Neon One's video guide, updated in June 2026, restates it as "57% of people who watch a nonprofit video go on to make a donation" Neon One; Auctria prints the same 57% with no source Auctria, Nonprofits Source lists 57% without a citation Nonprofits Source, and a video agency widens it to people who "donate, volunteer, or take further action", at 57% Hatch Studios.
"Campaigns with video raise 114% more"
This is a crowdfunding site's number, not a nonprofit one. The earliest dated version we found is Indiegogo's own blog on December 15, 2010: its campaigns with video pitches raised 114% more on average than campaigns without Indiegogo, across every kind of campaign and with no sample or method. Twelve days later the same blog said 122%Indiegogo. The December 2011 post most often quoted repeats 114%Indiegogo, and in October 2015 Indiegogo said, from 100,000 campaigns, that those with a pitch video raise 4 times more, the source of the "4x" line Indiegogo. Nonprofit guides now credit the figure to other companies: an Auctria webinar deck from March 2026 gives 114% and credits Classy Auctria, and a video agency gives 114% and credits GoFundMe Hatch Studios, whose own video guide gives no number.
"Crowdfunding campaigns with personal videos raise 105% (or 150%) more"
We found no study behind either. The earliest form is Fundly's crowdfunding statistics page, first captured in February 2018, which says campaigns with personal videos raise 105 % more, with no source Fundly. Nonprofits Source prints 150% beside the same neighbouring figures Nonprofits Source, and CharityHowTo attributes the 150% to Kickstarter CharityHowTo. Kickstarter's own figures are success rates, not amounts raised: in December 2009, of nearly 1,000 finished projects, those with videos succeeded 54% of the time Kickstarter and those without 39%Kickstarter; its Kickstarter School page, first captured with the figures in April 2012, says 50%Kickstarter against 30%Kickstarter, with no sample or period.
"Videos get 1,200% more shares than text and images combined"
This began as an August 2012 infographic by the PR firm M Booth and the analytics company Simply Measured, which found video posts on the biggest brands' Facebook pages were shared 12 times more than links and text posts combined Adweek, measured on the top 10 brand communities over two months, the Holmes Report wrote at the time: 12 timesPRovoke Media. It was about brands' Facebook pages, not nonprofits, and it compared video with links and text, not with images. Zeffy's fundraising-video guide said videos get 1200% more shares than text, citing no study, before a rewrite dropped the line Zeffy; a video agency credits the 1,200% to the software-review site G2 Hatch Studios.
"Video on a page lifts conversions 80%"
One vendor's best result for one client's landing page, around 2009. The video vendor EyeView ran an autoplaying video for first-time visitors to the online tutoring firm TutorVista's landing page and reported conversion up 86 percentEyeView. EyeView's two accounts of the test disagree on how it got there: its case-study index says conversion rose "by over 80% in the very first iteration" EyeView, while its white paper says the gain of over 86 percent came "after several rounds of testing" EyeView white paper, and the same index gives about 30% for other clients. Unbounce, which sells landing-page software, was relaying it as "a study" by August 2010, "can increase conversion by 80%" Unbounce, 2010, and its January 2013 list of landing-page "factoids to tweet" repeats 80%Unbounce, 2013; the full trace is on our video advertising statistics page. A 2026 donation-page guide now says videos raise donation-page conversions "by up to 80%" WP Charitable. The published donation-page tests point the other way: in the Texas State Historical Association test, sending donors through a page with a video cut donor conversion by 77.4%NextAfter and revenue per visitor by 81%, and at Hillsdale College a video lowered conversion by 20.9%.
"Video increases donation rates by 43%" and "donors who watch are 48% more likely to give"
The only published 43% result we found is an Indiana University Lilly Family School of Philanthropy experiment from January 2022, in which more than 1,500 participants were randomly shown a video, an email or a three-sentence description of one nonprofit Lilly Family School of Philanthropy. The video raised the rate at which people "connected" with the nonprofit, by signing up for a newsletter or giving $5, by 43% relative to the description Lilly Family School of Philanthropy. It did not measure donation rates against text-only appeals, as an IT firm's blog claims with no source: 43% Entechus. A London production company's statistics page credits "NPSource, 2023" for donors being 48% more likely to give after a video Here Now Films, "Blackbaud, 2023" for 72% being "very likely" to donate Here Now Films and "Convio, 2023" for storytelling raising donations 38% Here Now Films. Nonprofits Source carries no 48% figure, we found no Blackbaud publication with the 72%, and Convio stopped being a separate company when Blackbaud bought it in 2012.
"84% of millennials give to charity, an average $481 a year to 3.3 organizations"
Two studies spliced together. The 84% is Achieve's 2015 Millennial Impact Report: the share of 1,584 millennial employees at U.S. companies who gave in 2014 Achieve. The $481 and 3.3 charities come from Blackbaud's 2013 "Next Generation of American Giving", which put the share of Generation Y who give at 60%Blackbaud. Nonprofits Source prints the combined sentence with the 84% Nonprofits Source.
"Video in an email boosts click-through 65%"
Zeffy's rewritten video guide calls this "the strongest verified data point in the field" and cites Campaign Monitor: 65% Zeffy. Campaign Monitor's guide lists the 65% with no source, and its own introduction gives a different figure, "upwards of 50 percent" Campaign Monitor. We found no study behind it.
What to use instead: for whether video raises donations, the controlled tests in the video section, which mostly find no gain or a loss on donation pages and a positive return for randomized video ads against none; for how much nonprofits use video, our homepage count of the 200 biggest fundraising charities and M+R's benchmark of 74% with a YouTube presence.
We started from the questions people search for about nonprofit video statistics and looked for the organization that actually produced each answer. Every figure on this page sits in an evidence ledger with its source, the exact table or paragraph it came from, the measurement period, the population measured, and the date we checked it. This edition holds 319 figures from 57 publishers.
On October 30, 2026, each of the 288 sourced figures on this page was re-fetched with the fetch cache cleared and matched against the recorded wording: 6 BLS wage and employment figures through the BLS data API, 2 from pages that only load in a browser (the Charities Aid Foundation's U.S. page for its World Giving Report, and ZEvent) in headless Chromium, and the rest against the publisher's page or file or a dated Internet Archive capture. 41 figures cite Internet Archive captures, because bls.gov, the Charity Commission, the Australian and Canadian charity regulators, JustGiving and the old Indiegogo, Kickstarter and EyeView pages refused automated requests or no longer exist. We left out what we could not read or check: Nonprofit Tech for Good's 2026 report and the Charities Aid Foundation's full UK Giving 2026 report, which sit behind sign-up forms; Edelman's U.S. trust in NGOs, which appears only in a chart; Enthuse's Charity Pulse and the Nonprofit Marketing Guide survey, both behind forms; and the IRS's tax year 2022 charity totals, published only as spreadsheets. The 31 figures marked as our calculations are listed with their formulas below; 25 of them come from our own reading of IRS Form 990 e-file data and the 200 charities' homepages on October 30, 2026, published as charities.csv, and one compares them with our homepage video study.
We only cite the producer: government agencies, regulators, company filings and official posts, and the survey owner's own report. We do not cite statistics roundups, Statista-style aggregators, or salary sites without a public method. We did not bypass paywalls or sign-up forms; where a full report was gated, we used only the figures its publisher states publicly.
Figures marked "our calculation" are arithmetic on the cited numbers, and anyone can reproduce them:
This edition contains no Mark Studios customer data.
Limitations
Our charity sample is the top of the list, chosen mechanically. It is the 200 public charities with the most private contributions on their latest e-filed Form 990, so it includes hospital systems, universities, research institutes, pharmaceutical patient-assistance foundations and pass-through funds alongside household-name charities, and it says nothing about the hundreds of thousands of small nonprofits. Charities that file on paper or whose latest return was not in the IRS's 2024-2026 e-file releases are missing.
A homepage is one page. We read each charity's homepage once, on a desktop browser, on October 30, 2026; video on campaign pages, donation pages or social channels is not counted, and 15 homepages refused automated browsers.
Form 990 expense lines are self-reported. Each charity decides how to split costs between fundraising, programs and administration, and noncash gifts such as donated food and medicine inflate contributions for a few very large charities.
Several sources sell into this market. M+R and NextAfter sell fundraising services; Blackbaud, Neon One and Fundraise Up sell fundraising software; Nonprofit Tech for Good sells training; the platforms (YouTube, Meta, GoFundMe, PayPal Giving Fund, JustGiving, Tiltify) report on their own products. Each is labelled where it appears.
The video tests are few and narrow. Each NextAfter test covers one organization's page; Fundraise Up published no conversion rates; the only large randomized field experiment compares video ads with no ads. None of them settles whether video helps every kind of appeal.
Giving surveys measure different things. Shares of people who give differ with the question, the time window and whether religious or political gifts count; the table in that section shows the definitions side by side.
How to cite this page
For a single figure, cite the original publisher named next to it, and link here if the verification trail is useful to your readers. Each figure has its own anchor, so you can link straight to it, for example https://www.markstudios.com/research/nonprofit-video-statistics#DRV-010. To cite the page as a whole:
Mark Studios. "Nonprofit Video Statistics." Last verified Oct 30, 2026. https://www.markstudios.com/research/nonprofit-video-statistics
APA
Mark Studios. (2026, October 30). Nonprofit video statistics. https://www.markstudios.com/research/nonprofit-video-statistics
MLA
“Nonprofit Video Statistics.” Mark Studios, 30 Oct. 2026, www.markstudios.com/research/nonprofit-video-statistics.
Chicago
Mark Studios. “Nonprofit Video Statistics.” Last modified October 30, 2026. https://www.markstudios.com/research/nonprofit-video-statistics.
BibTeX
@misc{markstudios_nonprofit_video_statistics_2026,
  author = {{Mark Studios}},
  title = {{Nonprofit Video Statistics}},
  year = {2026},
  month = oct,
  url = {https://www.markstudios.com/research/nonprofit-video-statistics},
  note = {Last verified 2026-10-30}
}
Our calculations and the evidence table are free to reuse with attribution and a link to this page. Each underlying figure remains the claim of its original publisher, and some publishers ask for a link when their figures are reused.
We re-verify every figure quarterly and when a major source publishes a new edition. The next scheduled review is January 2027. Corrections go to contact@markstudios.com.
Oct 30, 2026: First published with 319 figures from 57 publishers, each checked against its original source.
Oct 31, 2026: Corrected the next day: M+R's $58 for 2024 comes from its previous edition and a different group of participants, so it is not the base of the 4% rise; a YouTube Giving fundraiser also needs a channel based in one of YouTube's available locations; GivingTuesday's 38.1 million participants include people who spoke out; the Economic Census count also covers business and professional associations and leaves out labor unions and political organizations; the more than 1,000 nonprofits behind Fundraise Up's figures are the ones its report analysed, not its customer count; and St. Jude gives no start year for PLAY LIVE's $100 million.
Frequently asked questions
How many nonprofits use video?
Most large ones link to a YouTube channel; about a third show video on the homepage. Of the 185 homepages we read among the 200 U.S. charities that raise the most from private donors, 31.9% showed video and 73.0% linked to YouTube. 74% of the mostly national nonprofits in the M+R Benchmarks Study had a YouTube presence in 2025, while Nonprofit Tech for Good's survey of mostly small nonprofits found 44% used YouTube.
Does video increase donations?
Not on donation pages, in the published tests. NextAfter's A/B tests found adding a video cut conversion by 20.9% on one page, and the same appeal as text converted 527.5% better than as video on another; Fundraise Up's test across about 26,000 visitors found no significant difference. Video ads can pay: a randomized Facebook video-ad campaign for Save the Children returned 1.45 euros per euro spent, compared with no ads.
How much do Americans give to charity each year?
An estimated $617.20 billion in 2025, according to Giving USA, 5.7% more than in 2024 in current dollars. Living individuals gave $394.2 billion of it, foundations $117.15 billion, bequests $62.19 billion and corporations $43.67 billion.
What share of charitable giving is online?
About one dollar in eight at a typical nonprofit: Blackbaud Institute put online giving at over 12% of all giving at the average U.S. nonprofit in 2023, and nearly 17% at small nonprofits. Online revenue grew 15% in 2025 at the median nonprofit in the M+R Benchmarks Study.
Can nonprofits raise money on YouTube?
Yes, through YouTube Giving: the Donate button, fundraisers and live-chat donations. A creator needs at least 10k subscribers, membership in the YouTube Partner Program and a channel based in one of YouTube's available locations to run a fundraiser, YouTube says 100% of each donation goes to the nonprofit, and the money can take up to 2 months to arrive. YouTube has not published a dollar total for YouTube Giving.
Do 57% of people who watch a nonprofit video donate?
No study shows that. The figure comes from Google's 2013 study with Millward Brown Digital, in which 57% of 982 online panelists who had already researched a nonprofit in the past year said they had donated after watching an online video. It is a self-reported answer from people already looking into charities, not the share of all viewers who give.
How often is this page updated?
Every figure is re-checked against its source each quarter, and sooner when a major source publishes a new edition: Giving USA each June, the M+R Benchmarks Study each spring, the Fundraising Effectiveness Project each quarter, and the IRS's monthly Form 990 releases for our own charity sample. Each change is recorded in the change log.