Every figure on this page links to the organization that produced it, and each was re-checked against that source before publishing. What the 25 biggest music channels on YouTube actually post (our own measurement), how much recorded music earns and how much of it comes from video and ad-supported streaming, what YouTube, Spotify and TikTok report about their own music business, how people listen to and watch music, what musicians earn, and where the popular music video numbers came from.
7 of the 9 most-subscribed YouTube channels that posted nothing between October 1 and 28, 2026 were music artists' channels; the median artist channel posted 0 times a week. (Our measurement)See details
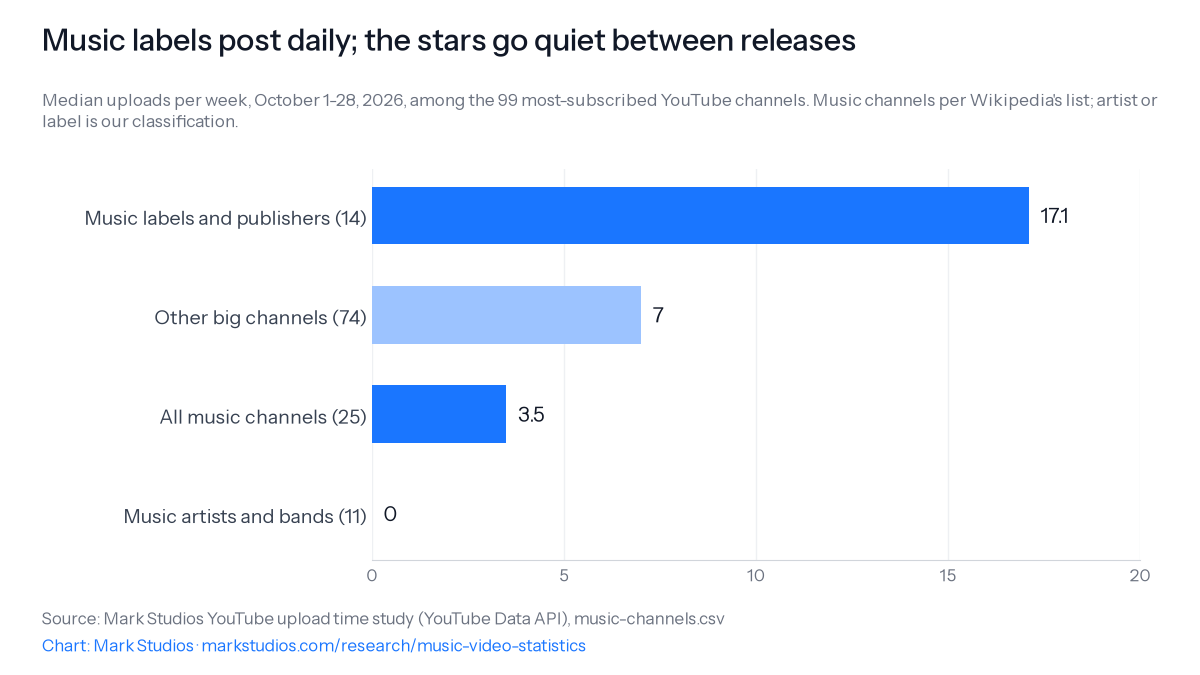
The median big music label channel posted 17.1 times a week, and labels made 98.5% of the big music channels' uploads. (Our measurement)See details
Artists' latest videos drew a median 18.4 likes per 1,000 views, against 5.7 on the label channels. (Our measurement)See details
The median big music channel's latest videos ran 3.45 minutes, against 21.4 minutes on other big channels. (Our measurement)See details
Only 3 of the 25 biggest music channels had a dub on any recent video, and none of their 125 latest videos carried a paid-promotion label. (Our measurement)See details
Recorded music earned labels US$31.7 billion worldwide in 2025, and streaming was 69.6% of it. (IFPI)See details
U.S. Free Streaming, the RIAA category that includes YouTube, brought in $1,789.3 million in 2025 at wholesale value, 15.5% of U.S. revenue. (RIAA; our calculation)See details
YouTube says it paid the music industry over $8 billion in the 12 months to June 2025, against over $4 billion in the 12 months to June 2021. (YouTube)See details
Video streaming took 31% of music listening time in IFPI's 2023 survey; YouTube took 18% of Americans' daily music listening time in Edison Research's. (IFPI; Edison Research)See details
Japanese labels still produced 33.218 million music DVDs and Blu-rays in 2024, while U.S. physical music video sold $8.9 million at retail. (RIAJ; RIAA)See details
About 170,400 Americans worked as musicians and singers in 2025, and BLS projects 0% growth to 2035. (U.S. Bureau of Labor Statistics)See details
The "music is 25% of YouTube views" claim has no source; the only count, by the vendor Pex, found music took 20% of views in 2018 and 22% in 2019. (Pex)See details
No survey publishes music video budgets; Billboard's 2019 interviews put them between $2,500 for an indie-label project and $700,000 or more for a pop star. (Billboard)See details
What do the biggest music channels on YouTube actually post?
Labels post short music videos every day, while the stars' own channels mostly go quiet between releases. Of the 99 most-subscribed YouTube channels we read in October 2026, 25 are music channels, and between October 1 and 28, 2026 they uploaded a median 3.5 times a week, against 7.0 for the other 74. That median hides two kinds of channel. The 14 label, publisher and kids' music channels (T-Series, Zee Music Company, Sony Music India, Hybe Labels and others) uploaded a median 17.1 times a week, and 11 of the 14 averaged at least one upload a day. The 11 artist and band channels (Taylor Swift, Bad Bunny, Blackpink and others) uploaded a median of 0 times a week: 10 of the 11 posted less than once a week, and 7 of the 9 channels in the whole top 99 that posted nothing in those four weeks were music artists' channels. Labels made 98.5% of the 1,239 uploads the 25 music channels posted.
The channels are the 99 most-subscribed YouTube channels on Wikipedia's list, read through the YouTube Data API in October 2026 for our upload time, video length, Shorts length, engagement rate, thumbnail, dubbing and metadata studies. A channel counts as music when Wikipedia's list puts it in the Music category; we split those 25 into artist channels and label channels ourselves. Every music channel's figures are in music-channels.csv, and each study publishes its own rows.
Music labels post daily; the stars go quiet between releasesMedian uploads per week, October 1-28, 2026, among the 99 most-subscribed YouTube channels. Music channels per Wikipedia's list; artist or label is our classification.
Regular videos with captions uploaded by the channel
16.0%
20.4%
Links in the description, median video
9
4
Engagement rate of regular videos, median channel
0.75%
1.18%
Music channels run short. On the median music channel the latest long-form videos ran 3.45 minutes, about the length of a song, and 22 of the 25 had a median under five minutes. Their titles run long because labels pack song, film and singer names between separators, and their thumbnails carry those names as headline text more often than other channels' do. Descriptions are link lists: streaming links, lyrics and credits.
Fans engage with artists, not labels. Regular videos that uploaders filed under YouTube's Music category had a median engagement rate (likes plus comments per view) of 0.65% across 930 videos from 16 big channels uploaded between September 30 and October 29, 2026, a little above the 0.60% median of all 2,574 counted regular videos. That category is dominated by label uploads. On the 11 artist channels, the latest five regular videos drew a median 18.4 likes per 1,000 views and had 3.24 million views, against 5.7 likes per 1,000 views and 126,000 views on the 14 label channels. Artists' latest videos were older, some from late 2024, which inflates their view counts, so compare views with care.
Two things music channels skip. Only 3 of the 25 had a dubbed audio track on any of their latest five videos, against 36 of 72 other big channels, and every dub we found on a music channel was on a tour diary or behind-the-scenes film, never a music video (details in the dubbing study). None of the 125 latest regular videos on the music channels carried YouTube's paid-promotion label, against 14 of 362 on the other channels.
How much does recorded music earn, and how much comes from video?
Recorded music earned record labels US$31.7 billion worldwide in 2025, and the ad-supported streaming that includes YouTube is the slowest-growing part of it. IFPI, the record labels' industry body, put global recorded music revenue at US$31.7 billion in 2025 IFPI, up from US$29.6 billion in 2024 IFPI. Streaming was 69.6% of the 2025 total IFPI and paid subscriptions alone 52.4%IFPI, from 837 million users of paid subscription accounts IFPI, up from 752 million in 2024 IFPI. Streaming first passed US$20 billion in 2024, at US$20.4 billionIFPI. IFPI's ad-supported category covers free audio tiers and video services such as YouTube; in 2024 it grew 1.2% while paid subscriptions grew 9.5% IFPI.
Global recorded music revenue and paid streaming accounts, as reported by IFPI each year
Year
Total revenue
Streaming
Users of paid subscription accounts
2022
not cited here
US$17.5 billionIFPI, of which paid subscriptions US$12.7 billionIFPI
Labels also collect performance rights, paid when recordings are broadcast or played in public: US$2.9 billion in 2025, up 0.3% IFPI, after a 5.9% rise in 2024 IFPI. Physical formats grew 8.0% in 2025, with vinyl up 13.7%IFPI. Licensing recordings to ads, film, games and TV (sync) brought labels US$640.4 million in 2022, 2.4% of the market IFPI. By region, USA and Canada held 38.7% of global revenue IFPI; in Latin America, the fastest-growing region, streaming was 88.1% of revenue IFPI, and in the Middle East and North Africa 97.5%IFPI.
Goldman Sachs, an investment bank, publishes forecasts rather than counts. Its research arm puts the whole music industry, publishing and live included, at $105 billion in 2024, growing to nearly $200 billion in 2035 Goldman Sachs; it estimates 2024 growth at 6.2%, after 15.6% in 2023 Goldman Sachs, and in August 2025 cut its forecast for ad-supported music streaming to 5.7% a year for 2025 to 2030, from 11.3% Goldman Sachs.
In the U.S.: what the RIAA counts
The RIAA, the U.S. labels' industry body, counted $11,535.3 million in U.S. recorded music revenue in 2025 at wholesale value, up 3.1% RIAA. Its "Free Streaming" category, ad-supported audio and music video services that do not operate under statutory licenses, including social media and user-generated video platforms such as YouTube, brought in $1,789.3 million, down 0.6% RIAA. That was 15.5% of U.S. revenue. Paid subscriptions brought in $5,881.1 million RIAA from an average 106.5 million paid accounts RIAA, about $55.22 per account for the year. All streaming together was $9,474.5 million RIAA; "Other Streaming", SoundExchange distributions plus other statutory digital radio, was $1,309.0 million RIAA. Licensing recordings to film, TV, ads and games (sync) brought in $407.1 million RIAA, and vinyl albums $1,042.9 million RIAA.
The first half of 2026 grew faster. U.S. revenue was $5,974.9 million, up 6.9% on the first half of 2025 RIAA; Free Streaming was $899.6 million, up 3.7% RIAA; paid subscriptions $3,112.6 million RIAA; and sync $231.8 million, up 18.2% RIAA.
The RIAA changed its basis in the 2025 report, from estimated retail value to wholesale value, and renamed its categories, so 2025 figures cannot be set against older totals. On the old retail basis, ad-supported on-demand streaming (YouTube, Vevo, the free tier of Spotify, Facebook and similar services) grew to 2.0 times its 2019 level by 2022 and then stopped growing:
U.S. revenue from ad-supported on-demand streaming, including music video services (RIAA, estimated retail value)
The U.S. total on the retail basis was $17.7 billion in 2024 RIAA, and SoundExchange distributions $1,054.0 million RIAA. Music video on disc has nearly gone in the U.S.: physical music video was worth $27.7 million at retail in 2019 RIAA, $11.3 million in 2022 RIAA and $8.9 million in 2024 RIAA, on 0.4 million units RIAA. That is a fall of 67.9% from 2019 to 2024. From the 2025 report the RIAA no longer lists it as its own line.
In the UK: what the BPI counts
The BPI, the UK labels' body, counted £1.57 billion in UK recorded music revenue in 2025, up 5.0% BPI. Ad-supported streaming passed £150 million for the first time, growing 13.9% to £163.4 millionBPI; ad-supported audio was £97.2 million of it BPI, which leaves about £66.2 million for ad-supported video and other services. Paid subscriptions brought in £902.2 millionBPI, streaming was 67.7% of all revenue BPI, sync £39.2 million, down 10.8% BPI, and vinyl £174.7 millionBPI. Video streams count toward the UK charts: Alex Warren's "Ordinary" was the only track to pass 200 million combined audio and video streams in 2025, at 261.9 millionBPI.
What do YouTube, Spotify and TikTok report about music video?
YouTube says it paid the music industry over $8 billion in the 12 months to June 2025, twice what it reported four years earlier. These are each company's own figures about its own platform, published in its own posts, and none of them is audited the way a label's revenue report is.
YouTube
YouTube says it paid out over $8 billion to the music industry between July 2024 and June 2025 YouTube, over $6B between July 2021 and June 2022 YouTube and over $4 billion in the 12 months to June 2021 YouTube. Over 30% of the 2021 money came from user-generated content, fans' videos that use a song and are claimed through Content ID YouTube, and over 30% again in 2022 YouTube; YouTube has not published the share since. It counted over 125 million YouTube Music and Premium subscribers, trials included, in its October 2025 post, the same figure it first announced in March 2025 YouTube, up from 100 million in January 2024 YouTube, and says over 2 billion logged-in viewers watch music videos on YouTube each month YouTube. Shorts, which YouTube calls a place for fans to discover new music, drew over 70 billion daily views in March 2025 YouTube. Music is moving to the living room: more than 50% of the viewing of Coachella's 2024 YouTube live stream was on connected TVs YouTube.
YouTube's owner reports the whole platform, not music: Alphabet booked $40,367 million of YouTube advertising revenue in 2025 Alphabet Inc., up from $36,147 million in 2024 Alphabet Inc., and said YouTube's ads and subscriptions together passed $60 billion in 2025 Alphabet Inc..
Vevo
Vevo, the label-owned music video network that distributes official videos on YouTube and connected TVs, tells advertisers it reaches 22B views a month worldwide Vevo and 154M U.S. viewers a month Vevo, with 1M+ official videos Vevo and 35+ connected-TV partners Vevo; the page carries no date. It said at its May 2024 NewFront that it reached 33 million viewers a day Vevo. Its most watched video of 2025, Lady Gaga and Bruno Mars' "Die With a Smile", drew 932 million views on Vevo between December 2024 and November 2025 Vevo; the biggest premiere, JENNIE's "like JENNIE", drew 33.4 million in its first 14 days Vevo. In 2024 KAROL G was its most watched artist for the fourth year running, with 3.5 billion views Vevo, and "POR EL CONTRARIO" its most watched video, with 312.7 millionVevo.
Spotify
Spotify says it paid the music industry more than $11 billion in 2025 Spotify and nearly $70 billion since it began Spotify. In 2025 more than 13,800 artists generated at least $100,000 in royalties from Spotify alone Spotify, more than 1,500 generated over $1 million Spotify, and the top 80 each generated more than $10 million Spotify; the 100,000th-highest-earning artist generated more than $7,300Spotify. Publishers and songwriter organizations received approximately $5 billion over 2024 and 2025 Spotify. These are royalties paid to rights holders, before labels and distributors take their share.
Spotify added music videos late. It launched them in beta on March 13, 2024 for Premium users in 11 markets, without the U.S. Spotify, added 85 additional markets that October Spotify, reaching nearly 100 marketsSpotify, and opened them to all Premium users in the U.S. and Canada on December 10, 2025Spotify. Spotify says listeners who discover a song and then watch its video on Spotify are 34% more likely to stream it again the following week Spotify and 24% more likely to save or share it Spotify, and that "super listeners" who discover a track with a video stream the artist 85% more in the next month Spotify. Spotify does not publish the comparison group or method for these figures, and a July 2026 Spotify post gives a different figure over a different window (see below). In a survey of 8,400 users in 19 markets run by the communications firm Burson in August to October 2025, which Spotify cites, more than 70% said more video would improve Spotify Spotify.
TikTok
TikTok's music figures come from reports it commissioned from Luminate, a data company that sells to the music industry. Its 2025 Music Impact Report says 84% of songs that entered the Billboard Global 200 in 2024 went viral on TikTok first TikTok, that U.S. TikTok users are 74% more likely than the average short-form video user to discover and share new music on such platforms TikTok, that U.S. music listeners who use TikTok are 68% more likely to pay for a music streaming subscription than the U.S. general population TikTok, that U.S. TikTok users spend 46% more on music each month than the average U.S. music listener TikTok, and that artists it calls TikTok-correlated see 11% average week-over-week streaming growth against 3% for others TikTok. TikTok says its Add to Music App button generated more than one billion track saves on streaming services after it rolled out in 2024 TikTok, and over 3 billion by December 2025 TikTok. Its 2025 Year in Music says 8 out of the 10 songs that reached No. 1 on the Billboard charts in 2025 had a TikTok viral moment first TikTok; its track of the year, Connie Francis's 1962 "Pretty Little Baby", was used in over 28.4M videos TikTok, sombr's "back to friends" in over 7.7MTikTok, and the group KATSEYE drew over 30 billion views on videos using its music TikTok.
How much music listening happens on video platforms?
Roughly a fifth to a third of music listening time, depending on who counts and how. IFPI's 2023 survey found video streaming, long-form and short-form, took 31% of music listening time in its core 18 countries IFPI; Edison Research puts YouTube at 18% of Americans' daily music listening time, counted separately from audio streaming services Edison Research. Neither counts the same thing, so the table sets the measures side by side.
Music on video platforms, as each survey owner measures it
IFPI's Engaging with Music 2023 surveyed over 43,000 people aged 16 to 64 in 26 countries between August and October 2023 IFPI. They listened to music for 20.7 hours a week IFPI, up from 20.1 hours in 2022 IFPI. Music was central to 54% of the time they spent watching short-form video apps IFPI, down from 63% in 2022 IFPI. 73% listened through licensed audio streaming services IFPI, and 29% used unlicensed or illegal ways to listen to or get music IFPI. In the 2022 edition, over 44,000 internet users in 22 countries IFPI, video streaming was the most common way to engage with music, and 68% used short-form video for music IFPI. IFPI is the record labels' industry body; its 2023 edition was the latest we could find on its site.
In the U.S.
Music takes 74% of Americans' daily audio time Edison Research. AM/FM radio and its streams still carry the largest share of music listening, 32%Edison Research, against 28% for audio streaming services such as Spotify, Apple, Amazon, Pandora and YouTube Music Edison Research and 18% for YouTube music video. Among 13- to 22-year-olds, YouTube takes 28% of all audio time when podcasts are included Edison Research. Of Americans 12 and older who say keeping up with music matters to them, 70% use YouTube to do it, second only to friends and family Edison Research; among 12- to 34-year-olds, 58% use TikTok Edison Research. 78% of Americans 12 and older used YouTube in the last week of January 2026 Edison Research. Edison Research sells audience research; its Share of Ear posts do not state sample size or field dates.
Pew Research Center's 2018 study of YouTube's recommendations looked at the 50 videos YouTube recommended most often. Fourteen of them were music videos by major artists Pew Research Center, and music and dance made up 9% of the videos that popular channels, those with 250,000 or more subscribers, posted in the first week of 2019 Pew Research Center.
In the UK
Ofcom, the UK regulator, finds music is what adults watch on YouTube most: 49% had viewed music there in the past three months in 2026, ahead of how-to videos Ofcom, and so had 59% of 13- to 17-year-olds Ofcom. Its 2026 audio survey ranked YouTube first among the UK's most-used online audio services Ofcom. 90% of adults listen to some music each week Ofcom; 61% use an online music service weekly, close behind music radio Ofcom, rising to 92% of 16- to 24-year-olds Ofcom, and 48% of 16- to 34-year-olds use one several times a day Ofcom. 65% of adults listened to streamed music at least monthly, up from 46% in 2019 Ofcom. Parents say 56% of children under 18 listen to online music services Ofcom. Background listening to online music video was the one audio type whose weekly reach fell significantly, to 43% from 46% Ofcom. 23% of online music listeners follow artists or get new-release alerts in their apps Ofcom, and 55% pick music from playlists they made themselves Ofcom.
Japan is the one big market where music video on disc still sells: Japanese labels produced 33.2 million music DVDs and Blu-rays in 2024. The Recording Industry Association of Japan (RIAJ), the Japanese labels' body, counted 33.218 million physical music video units produced by its members in 2024 RIAJ, worth 56.2 billion yen RIAJ, 27% of the value of all physical music they produced RIAJ. Both fell sharply: DVDs to 14.42 million units RIAJ and Blu-rays to 18.80 million RIAJ, worth 39.9 billion yen RIAJ. Almost all of it is Japanese repertoire, 32.879 million of the units RIAJ.
RIAJ is also one of the few bodies that splits music video streaming from audio. In 2024 its members earned 7,165 million yen from ad-supported music video streams, up 16% RIAJ, more than the 5,263 million yen from subscription music video streams RIAJ; music video downloads came to 154 thousand RIAJ. All streaming brought in 113.2 billion yen RIAJ. RIAJ's estimate for the whole Japanese market in 2025, including non-member labels, is 398.8 billion yen RIAJ, with physical music video at 50.7 billion yen RIAJ, subscription streaming of music and music video at 137.7 billion yen RIAJ and ad-supported streaming at 20.2 billion yen RIAJ. The 2025 estimate covers a wider set of companies than the 2024 member figures, so the two years should not be compared.
In the UK, video streams count toward the charts. Video joined the Official Singles Chart in July 2018 and the Official Albums Chart in January 2023 Official Charts Company; in 2018 the Official Charts Company set the rate at 100 paid streams or 600 free ad-funded streams to one sale, the same for video and audio Official Charts Company. The BPI counted 210.3 billion audio streams in 2025 BPI, streaming made up 89.3% of UK music consumption BPI, and total consumption reached 210.3 million albums or their streamed equivalent BPI. UK revenue is in the revenue section above.
Across the EU, Eurostat found 79% of internet users aged 16 to 74 streamed TV or video in 2024 Eurostat and 65% listened to or downloaded music Eurostat, highest in Ireland at 82%Eurostat and 89% among students Eurostat. 23% paid for a music streaming subscription in 2025 Eurostat, and 6% bought CDs, vinyl, DVDs or Blu-rays online in 2024 Eurostat.
How many people make music and music video for a living, and what do they earn?
About 170,400 Americans worked as musicians and singers in 2025, nearly half of them self-employed, and the Bureau of Labor Statistics expects no growth in that number to 2035. The BLS Occupational Outlook Handbook counts about 170,400 musician and singer jobs in 2025, self-employed included U.S. Bureau of Labor Statistics, 48% of them held by self-employed workers BLS, and projects 0% change from 2025 to 2035 BLS, with about 17,400 openings a year, mostly to replace people who leave BLS. Employer payrolls show only a fraction: the May 2025 Occupational Employment and Wage Statistics survey counted 36,180 wage-and-salary jobs for musicians and singers BLS, paid by the hour, at a median of $47.80 and a mean of $60.46BLSBLS. BLS publishes no annual wage for them because most are not paid year-round.
U.S. music and video jobs on employer payrolls, May 2025 (BLS Occupational Employment and Wage Statistics; self-employed not included)
BLS projects employment of film and video editors and camera operators, the people who cut and shoot music videos among other work, to grow 3% from 2025 to 2035 BLS. The two counts in the table differ because the Handbook includes self-employed workers and the payroll survey does not.
Music businesses
BLS's Quarterly Census of Employment and Wages counted an annual average of 6,001 private establishments classed as musical groups and artists in 2025 BLS, employing 34,763 people BLS at an average $81,896 a year BLS. Record production and distribution employed 7,658BLS at an average $202,574BLS; there were 1,204 music publishers BLS, 1,958 sound recording studios paying an average $81,139BLSBLS, and 24,396 motion picture and video production establishments BLS. Most music businesses have no employees at all: the Census Bureau counted 42,969 sound recording businesses without payroll in 2023 U.S. Census Bureau, with $1,292,218 thousand in receipts between them U.S. Census Bureau, 1,088,020 independent artists, writers and performers U.S. Census Bureau, and 128,682 motion picture and video businesses U.S. Census Bureau.
Music video is licensed differently from audio. U.S. copyright law's compulsory license for songs (Section 115) applies to phonorecords, which the law defines to exclude the sounds accompanying a motion picture or other audiovisual work (17 U.S.C. 101), so putting a song in a video takes a synchronization license negotiated with the publisher. For audio, the Copyright Royalty Board sets the rates: on-demand streaming services pay songwriters and publishers a headline rate that rises from 15.1% of service revenue in 2023 to 15.35% in 2027 Copyright Royalty Board, and a song on a physical copy or download earns 13.1 cents in 2026 Copyright Royalty Board. The Mechanical Licensing Collective, which collects the streaming mechanicals, says it had distributed more than $4.2 billion by September 2026 The MLC, matching more than 92% of the royalties it processed The MLC, for more than 100,000 members The MLC. SoundExchange, which collects for recordings played on digital radio, distributed $991.5 million in 2025 SoundExchange and more than $13 billion since 2003 SoundExchange.
What the popular music video numbers really say
The pages that rank for music video statistics today are mostly unsourced lists. We collected the claims they repeat and traced each to the organization that first published it. Some have no origin at all; others began as a narrower survey answer, one label's royalty statements, or a vendor's count from 2018.
"Over 50% of a music video's views come in the first 24 hours"
We found no study behind this. WifiTalents prints it with no source, date or sample WifiTalents. Exact-phrase searches for the claim and its variants, Internet Archive captures, trade press from Billboard to Tubefilter, and Vevo's and YouTube's press pages turned up only absolute 24-hour view records, never a share of a video's lifetime views. The nearest sourced figure measures something else. Fifty-four percent of 899 U.S. Gen Z respondents in Vevo's March 2021 Media Tracker survey said they watch music videos the first week they come out Vevo: a habit, not a share of views. What is public is the size of a launch: Vevo says its biggest premiere of 2025 drew 33.4 million views in 14 days. Only a video's owner can see how its views are spread over time, in YouTube Analytics.
"Music is 25% of all YouTube views"
YouTube does not publish views by category, and we found no source for 25% WifiTalents. The figure everyone else cites is a vendor's: Pex, which sells music identification tools to rights holders, indexed every public YouTube video and found the Music category took 20% of views in 2018 while making up 5% of videos Pex, and 22% in 2019 Pex. Music also took 83% of videos with more than a billion views Pex, which is the nearest real number to the unsourced "93% of the most-watched YouTube videos of all time are music videos" WifiTalents. Pex counts only videos uploaders filed under Music, and its last edition covers 2019.
"YouTube is almost half of all music streaming"
This comes from IFPI, the labels' body, during its campaign against YouTube's payouts. Its 2017 Music Consumer Insight Report found YouTube took 46% of time spent listening to on-demand music IFPI, and the 2018 edition put it at “Nearly half” IFPI. The same surveys found 85% of YouTube visitors used it for music in the past month in 2017 IFPI, against 82% of YouTube users over the past six months in 2016, a different question IFPI, and in 2017 76% used it for music they already knew IFPI; in 2016, 58% of YouTube music users used it to discover new music IFPI. These were on-demand listening only, excluding radio. IFPI's later surveys measure all listening: in 2023 video streaming, short-form included, took 31% of it, and Edison Research puts YouTube at 18% of Americans' daily music listening. Use those.
"YouTube pays $0.00069 per stream"
This comes from one anonymous independent label. The artist-advocacy blog The Trichordist publishes a "Streaming Price Bible" built from that label's royalty statements. Its January 2017 edition, covering about 150 albums in 2016, found YouTube's subscription service carried over 21% of the label's audio streams but less than 4% of its revenue, and its rate table lists YouTube at $0.00069 a stream The Trichordist. That line was YouTube's paid service, not music video views, which is how lists repeat it today. The first edition, in November 2014, put YouTube at $1,750 per million plays The Trichordist. Later editions added Content ID, the money from user uploads: it carried 48% of the label's streams but 7% of revenue in 2018 The Trichordist and 51% of streams but 6.4% of revenue in 2019 The Trichordist.
The two sides of the 2017 dispute disagree on the rate. YouTube's head of music wrote that it paid over $3 per thousand streams in the U.S. YouTube, in the post where he said YouTube had paid over $1 billion to the music industry from ads YouTube; the RIAA answered that the real 2016 figure was closer to half that amountRIAA. IFPI's per-user comparison, the "value gap", set Spotify's US$18 per user in 2014 against less than US$1 for YouTube in 2015 IFPI, and the next year's report said Spotify paid US$20 and YouTube less than US$1IFPI. YouTube publishes no per-stream rate. What it does publish is its total: $8 billion to the music industry in the 12 months to June 2025.
"An indie music video costs $200 to $5,000"
No survey owner, trade body or government agency publishes music video budgets. The $200 to $5,000 range is an editorial estimate by iMusician, a distributor that sells to independent artists, with no survey behind it iMusician. "Indie artists spend an average of $12,000 on music videos, compared to $1.5 million for major label acts" appears only on ZipDo, which labels it directional ZipDo, and "$50,000 to $300,000 for a major label video" only on WifiTalents WifiTalents. The most credible printed range is Billboard's, from interviews with managers, directors and Vevo in May 2019: from $2,500 for an indie-label project to $700,000 or more for a pop star Billboard. The only published budget rule we found comes from a funder: FACTOR, Canada's music funding body, pays half of a music video's eligible budget, up to $20,000 or $30,000 depending on the artist's tier, in 2026-27 FACTOR.
"68% of Gen Z discover music through music videos" and "1.8 times more likely to buy"
Neither has an origin we could find ZipDoWifiTalents. The sourced figures are narrower. In Vevo's 2021 survey, 63 percent of U.S. Gen Z respondents said they watch music videos to find new artists Vevo. A 2018 Ipsos survey for Google found 91% of YouTube music users who bought something music-related in the past year had watched a related YouTube video first Google. Spotify says listeners who stream a full-length video on Spotify play that song 64% more often over the next three weeks than similar fans who only heard the audio Spotify, and that those who discover a song and then watch its video are 34% more likely to stream it again the next week. Spotify publishes no method for either.
We started from the questions people search for about music video statistics and looked for the organization that actually produced each answer. Every figure on this page sits in an evidence ledger with its source, the exact table or paragraph it came from, the measurement period, the population measured, and the date we checked it. This edition holds 294 figures from 27 publishers.
On October 31, 2026, each of the 251 sourced figures on this page was re-fetched with the fetch cache cleared and matched against the recorded wording: 16 BLS wage and employment figures through the BLS data API, 6 from the Indian Music Industry's 7 MB report, re-downloaded with a longer time limit, and the rest against the publisher's page or file or a dated Internet Archive capture. 38 figures cite Internet Archive captures, because ofcom.org.uk, edisonresearch.com and bls.gov refused automated requests, and older IFPI, RIAA, Google and Trichordist pages have moved. We left out what we could not read or check: Luminate's year-end and consumer reports, which sit behind contact forms; IFPI's full Global Music Report, behind a terms form, so its 2025 ad-supported streaming growth is missing; the UK Intellectual Property Office's 2024 tracker, published only as spreadsheet files; and figures printed only in charts. The 43 figures marked as our calculations are listed with their formulas below; 38 of them come from our own YouTube studies' published data, joined in music-channels.csv.
We only cite the producer: government agencies, regulators, company filings and official posts, and the survey owner's own report. We do not cite statistics roundups, Statista-style aggregators, or salary sites without a public method. We did not bypass paywalls or sign-up forms; where a full report was gated, we used only the figures its publisher states publicly.
Figures marked "our calculation" are arithmetic on the cited numbers, and anyone can reproduce them:
This edition contains no Mark Studios customer data.
Limitations
Our channel sample is the top of the list. The 25 music channels are those Wikipedia's list of the most-subscribed YouTube channels files under Music, read in October 2026. They lean toward Indian labels and global stars, and they say nothing about the typical independent artist's channel. The split into artist channels and label channels is our own classification, listed in music-channels.csv.
Each measure covers a short window. Upload counts cover October 1 to 28, 2026, and the other measures read each channel's latest videos, so a channel between releases or in the middle of a campaign can look unusual. Artists' latest videos were older than labels', which inflates their view counts.
Industry bodies count their members' money. IFPI and the RIAA report record labels' revenue, not what artists receive, and the RIAA switched from estimated retail value to wholesale value in its 2025 report, so its 2025 figures cannot be compared with earlier years' totals.
Platforms report on themselves. YouTube, Spotify and TikTok choose which figures to publish and how to define them. TikTok's music reports were commissioned from Luminate, a data company that sells to the music industry, and Spotify's video survey was run by a communications firm. Each is labelled where it appears.
Surveys of listeners differ in method. IFPI, Edison Research and the other survey owners ask different questions of different samples, so their shares of listening on video platforms do not line up; the page shows each with its own definition.
How to cite this page
For a single figure, cite the original publisher named next to it, and link here if the verification trail is useful to your readers. Each figure has its own anchor, so you can link straight to it, for example https://www.markstudios.com/research/music-video-statistics#DRV-005. To cite the page as a whole:
Mark Studios. "Music Video Statistics." Last verified Oct 31, 2026. https://www.markstudios.com/research/music-video-statistics
APA
Mark Studios. (2026, October 31). Music video statistics. https://www.markstudios.com/research/music-video-statistics
MLA
“Music Video Statistics.” Mark Studios, 31 Oct. 2026, www.markstudios.com/research/music-video-statistics.
Chicago
Mark Studios. “Music Video Statistics.” Last modified October 31, 2026. https://www.markstudios.com/research/music-video-statistics.
BibTeX
@misc{markstudios_music_video_statistics_2026,
  author = {{Mark Studios}},
  title = {{Music Video Statistics}},
  year = {2026},
  month = oct,
  url = {https://www.markstudios.com/research/music-video-statistics},
  note = {Last verified 2026-10-31}
}
Our calculations and the evidence table are free to reuse with attribution and a link to this page. Each underlying figure remains the claim of its original publisher, and some publishers ask for a link when their figures are reused.
We re-verify every figure quarterly and when a major source publishes a new edition. The next scheduled review is January 2027. Corrections go to contact@markstudios.com.
Oct 31, 2026: First published with 294 figures from 27 publishers, each checked against its original source.
Oct 31, 2026: Corrected the same day: IFPI's 82% of YouTube users using it for music in 2016 covered the past six months and its 85% in 2017 the past month, so the page no longer shows a rise from one to the other; Luminate's report compares TikTok users' 68% higher likelihood of paying for a streaming subscription with the U.S. general population and their 46% higher monthly music spending with the average U.S. music listener, and the page now says so; YouTube's 70 billion daily Shorts views are dated to March 2025; and Edison's 23% is the share of all audio time spent on music on YouTube, not YouTube's share of music listening.
Frequently asked questions
How much does YouTube pay the music industry?
YouTube says it paid out over $8 billion to the music industry in the 12 months from July 2024 to June 2025, up from over $6 billion in the 12 months to June 2022 and over $4 billion in the 12 months to June 2021. The totals include advertising and subscription money and are YouTube's own figures; it does not say how much of it reaches artists after labels and distributors take their share.
How often do the biggest music channels upload to YouTube?
It depends on who runs the channel. In our October 2026 count of the 25 biggest music channels, the median label or publisher channel uploaded 17.1 times a week, while the median artist or band channel uploaded 0 times a week between October 1 and 28; 10 of the 11 artist channels posted less than once a week.
How long is a typical music video on YouTube?
About the length of a song. On the median music channel among the most-subscribed on YouTube, the latest long-form videos ran a median 3.45 minutes in October 2026, and Shorts ran 33.5 seconds.
How much music listening happens on YouTube and other video platforms?
Roughly a fifth to a third of listening time, depending on the measure. IFPI's 2023 survey of internet users in 18 core countries found video streaming took 31% of music listening time; Edison Research puts YouTube at 18% of Americans' daily music listening time. In the UK, Ofcom found 49% of adults had watched music on YouTube in the past three months of 2026.
How much money does recorded music make?
IFPI, the labels' industry body, put global recorded music revenue at US$31.7 billion in 2025. In the U.S., the RIAA counted $11,535.3 million at wholesale value in 2025, of which $1,789.3 million came from Free Streaming, the category that includes YouTube and other ad-supported music video services.
Do most of a music video's views come in the first 24 hours?
No study shows that. The claim that over 50% of a music video's views come in its first 24 hours appears on statistics lists with no source, and we found no original in trade press, Vevo's or YouTube's pages, or archived copies. The nearest sourced figure measures habits: 54% of 899 U.S. Gen Z respondents in Vevo's March 2021 survey said they watch music videos the first week they come out. Only a video's owner can see how its views spread over time, in YouTube Analytics.
How often is this page updated?
Every figure is re-checked against its original source each quarter, and sooner when a major source publishes a new edition, such as IFPI's Global Music Report and the RIAA's year-end report each March. The Last verified date changes only after that check, and each change is recorded in the change log.