What engagement rate do the biggest YouTube channels get? We read the views, likes and comments of every upload that 83 of the 100 most-subscribed channels posted over four weeks of October 2026, 4,849 with enough views to count. Here is the typical rate for videos and Shorts, how many likes and comments a view brings, which channels lead, how views and age change it, why YouTube's August 2026 change to view counting matters, and how the published benchmarks compare.
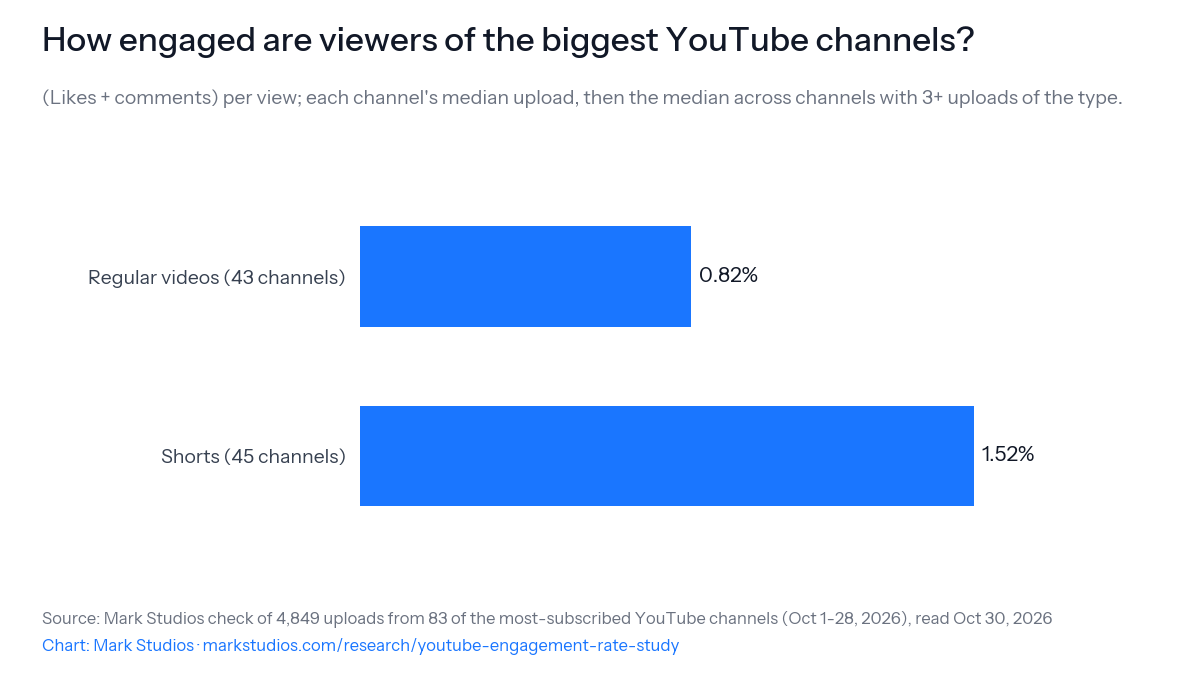
The typical regular video from the biggest YouTube channels gets 0.82% engagement: likes plus comments, divided by views. That is the median across 43 channels of each channel's median video, from 4,849 uploads posted October 1 to 28, 2026; the middle half of channels run from 0.55% to 2.15%. See details
That is well under half of the lowest published benchmark (2.24%). Benchmarks sample smaller channels, often count shares or divide by impressions, and mostly predate August 24, 2026, when YouTube began counting a view the moment any video starts to play. See details
Shorts did better: the typical big-channel Short got 1.52%, against 0.82% for regular videos. See details
Likes are nearly all of it: about 1 like per 131 views and 1 comment per 2,833 views on a typical big-channel video, roughly 22 likes for every comment. See details
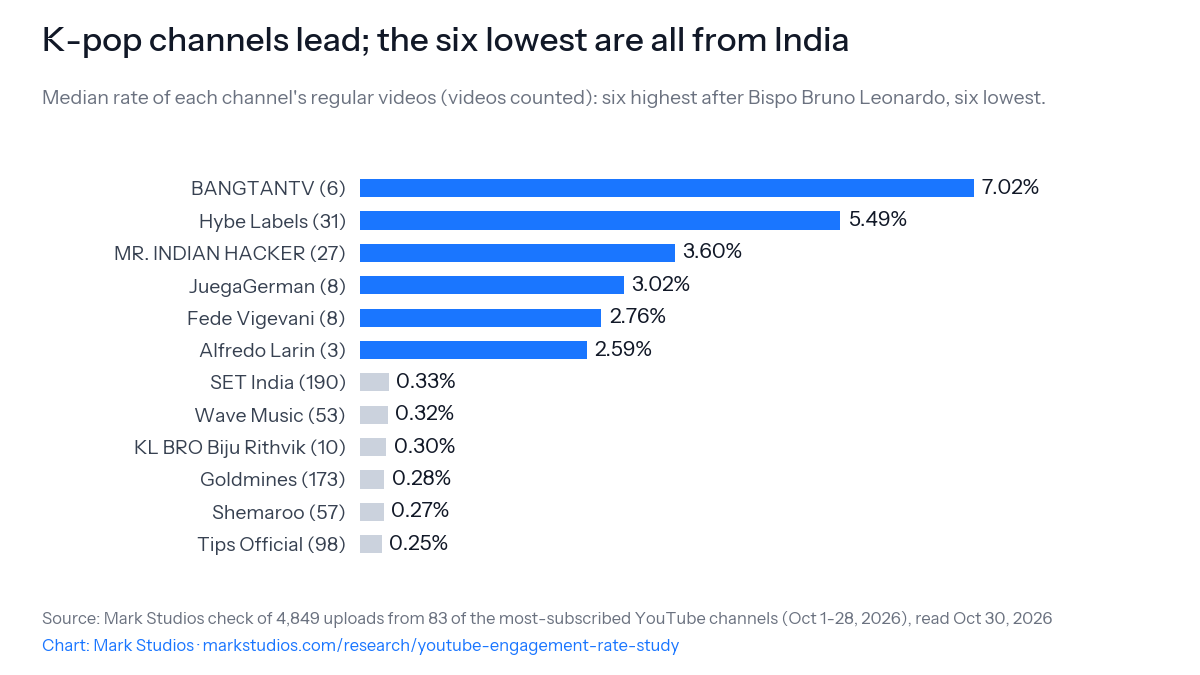
K-pop channels lead (BANGTANTV 7.02%, Hybe Labels 5.49%); all six of the lowest are Indian channels, near 0.3%. Off the scale, Bispo Bruno Leonardo's prayer videos, posted four times a day, got 53.52%. See details
Even MrBeast's two October videos got 1.30% and 1.47%, on 169 million and 312 million views. See details
Engagement rate barely moved with age in the first month: 0.58% for regular videos read 1 to 7 days after upload, 0.56% at 22 to 30 days. See details
806 uploads from 26 channels were set as made for kids, where YouTube turns comments off; we leave them out of the rate. See details
What is the average engagement rate on YouTube?
For the biggest channels, under 1% on a regular video. We read the views, likes and comments of every upload that 83 of the 100 most-subscribed YouTube channels posted from October 1 to 28, 2026, one to thirty days after each went up. Counting uploads with at least 1,000 views, public like and comment counts and comments allowed (4,849 in all), the median channel's typical regular video got 0.82% engagement: likes plus comments, divided by views. The middle half of the 43 channels with 3 or more such videos ran from 0.55% to 2.15%.
How engaged are viewers of the biggest YouTube channels?(Likes + comments) per view; each channel's median upload, then the median across channels with 3+ uploads of the type.Use this chart on your site
Each channel counts once: we take each channel's median video, then the median across channels, so a network that posted a hundred clips in four weeks weighs the same as a creator who posted three videos. Counted upload by upload instead, the median regular video got 0.60%, lower because the channels that post the most clips tend to get the least engagement on each.
Check your own video
Enter a video's views, likes and comments to get its engagement rate and see how it compares with the typical video of each of the biggest channels in October 2026. A standalone version, with a code to embed it on your own site, is our free YouTube engagement rate calculator.
Engagement rate: 2.65%
How many likes and comments does a YouTube video get per view?
About 1 like per 131 views and 1 comment per 2,833 views. The median channel's typical regular video drew 7.6 likes and 0.35 comments per 1,000 views, roughly 22 likes for every comment. Engagement rate is mostly a like rate.
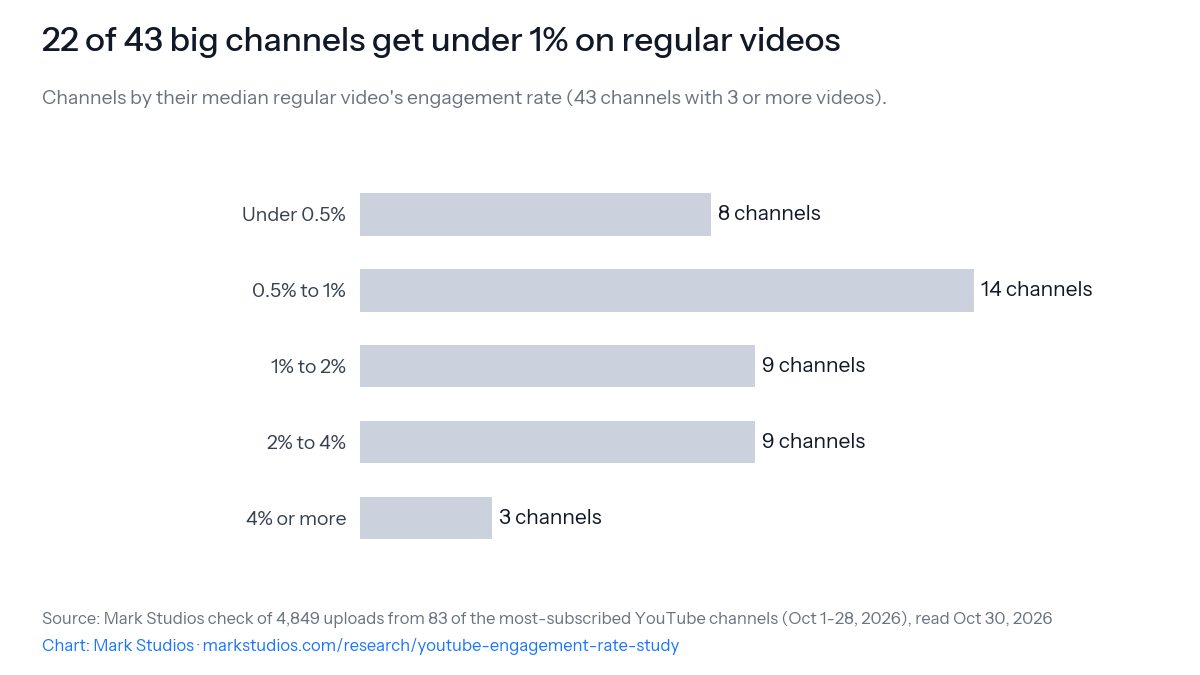
22 of 43 big channels get under 1% on regular videosChannels by their median regular video's engagement rate (43 channels with 3 or more videos).Use this chart on your site
Channels differ far more than formats do: 22 of the 43 channels had a median regular video under 1%, and 3 reached 4% or more.
Do Shorts get more engagement than regular videos?
On the biggest channels, yes. The median channel's typical Short got 1.52% against 0.82% for its typical regular video (45 channels posted 3 or more Shorts with at least 1,000 views; the middle half ran from 1.16% to 2.66%). Shorts drew 1 like per 66 views but only 1 comment per 6,165.
That is despite how Shorts are counted. Since March 31, 2025, a Shorts view counts every time a Short starts to play or replay, with no minimum watch time (YouTube Help), so a Short that loops collects several views from one viewer. Since August 24, 2026, regular videos count views from the first frame too.
Which YouTube channels get the most engagement?
K-pop channels lead: BANGTANTV's typical regular video got 7.02% and Hybe Labels' 5.49%. At the other end, all six of the lowest channels are from India, with typical videos around 0.3%. Even MrBeast's two regular videos in October got 1.30% and 1.47%, on 169 million and 312 million views within a month of upload.
K-pop channels lead; the six lowest are all from IndiaMedian rate of each channel's regular videos (videos counted): six highest after Bispo Bruno Leonardo, six lowest.Use this chart on your site
One channel is off this chart's scale. Bispo Bruno Leonardo, a Brazilian bishop, posts prayer videos four times a day (dawn, noon, evening and midnight) in which viewers leave comments of their own; the channel's typical video got 53.52%, and 44 of its 109 counted videos drew more comments than likes. Every channel's figure is in the table at the end.
By YouTube category, the one each uploader picks for a video, Sports had the highest median (1.54%) and Film & Animation the lowest (0.43%), counting categories with at least 40 regular videos from three or more channels.
Every category
Category
Videos
Channels
Median engagement
Likes per 1,000 views
Comments per 1,000
Sports
125
3
1.54%
14.3
0.9
Music
930
16
0.65%
6.1
0.29
Entertainment
833
20
0.45%
4.3
0.12
Film & Animation
463
4
0.43%
4.1
0.16
Do videos with more views get less engagement?
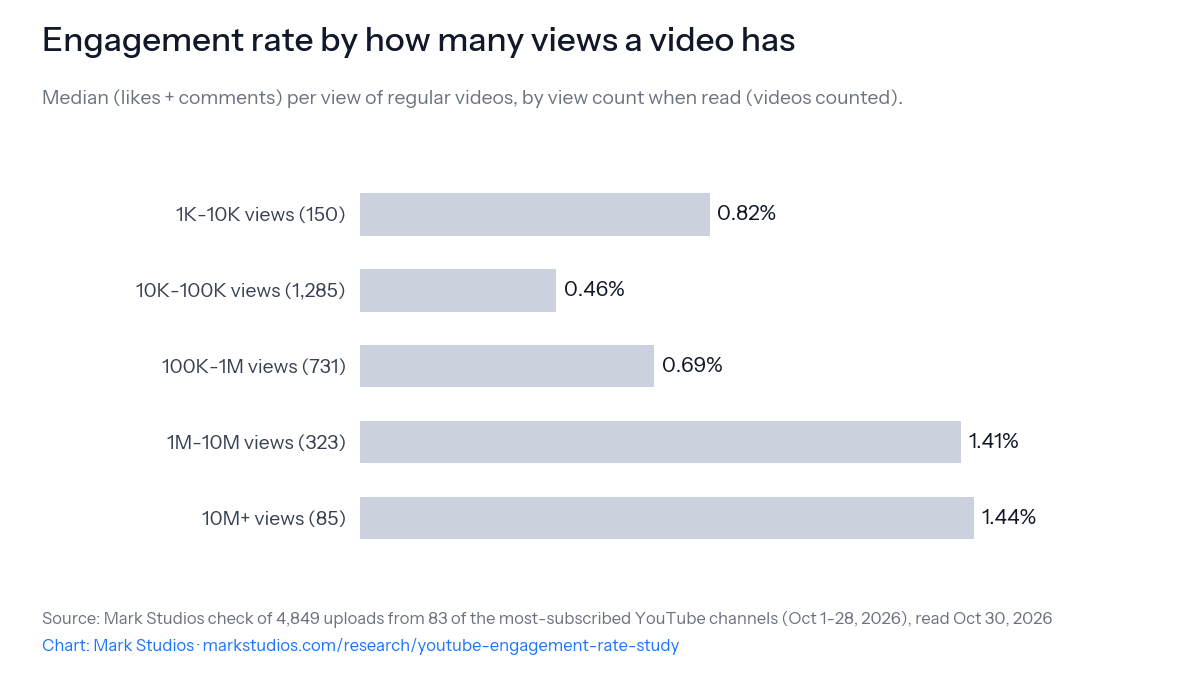
Not among the biggest channels: the most-watched videos had the highest rates. Regular videos with 10M+ views had a median of 1.44%, against 0.46% for those with 10K to 100K. That is mostly a difference between channels: 1,090 of the 1,435 regular videos under 100,000 views came from channels in India, the country with the lowest median here.
Engagement rate by how many views a video hasMedian (likes + comments) per view of regular videos, by view count when read (videos counted).Use this chart on your site
Does engagement rate change as a video gets older?
Hardly at all within the first month. Regular videos read one to seven days after upload had a median rate of 0.58% and those read 22 to 30 days after, 0.56%; for Shorts, 1.72% and 1.62%. Each upload was read once, so this compares different videos rather than following one, but a rate read a few days after upload looks much like one read a month in.
Age when read
Videos
Median engagement
Likes per 1,000 views
Comments per 1,000
1-7 days
803
0.58%
5.5
0.21
8-14 days
733
0.64%
6
0.22
15-21 days
499
0.60%
5.6
0.27
22-30 days
539
0.56%
5.2
0.25
Does engagement differ by country?
Channels from the United States had a median of 0.70% on regular videos and channels from India 0.49%; the rest, led by South Korea's K-pop channels and Brazil's Bispo Bruno Leonardo, 3.02%. Country is the first one Wikipedia lists for each channel.
Channel country
Videos
Median video engagement
Shorts
Median Shorts engagement
India
1,823
0.49%
1,172
1.70%
United States
432
0.70%
295
2.19%
Other
319
3.02%
719
1.20%
By video length
Length
Videos
Median engagement
under 4 min
810
0.73%
4-10 min
486
0.58%
10-20 min
431
0.50%
20 min+
847
0.48%
What about kids' videos and hidden counts?
YouTube turns comments off on any video whose audience is set as made for kids (YouTube Help). 806 of the 5,799 uploads we read, from 26 channels, were set that way, and 132 had no public comment count, 122 of them made for kids. Because likes alone can't be compared with likes plus comments, we leave these uploads out of the engagement rate; made-for-kids regular videos drew a median of 3 likes per 1,000 views (398 videos). 2 uploads from 2 channels hid their like count and are left out too.
How YouTube's view counting changed in 2026
Since August 24, 2026, YouTube counts a view the moment a video starts to play, across Shorts, long-form videos and live streams (YouTube Help); the API's view count works the same way and includes autoplay (YouTube Data API). Shorts had counted that way since March 31, 2025. YouTube says Partner Program earnings are still based on "engaged views", and for Shorts it keeps the earlier count in YouTube Analytics under that name.
Every upload in this study went up after the change, so its views are counted the new way. Likes and comments are not affected, so a channel's engagement rate falls when more of its plays count as views. Benchmarks built on 2025 data, or on a year of videos that mostly predate August 24, are therefore not like for like with rates measured on new uploads today.
How this compares with other YouTube engagement benchmarks
The published figures disagree mostly because they measure different things.
Median 2.24%, average 3.51%; Shorts average 2.98%, long-form 3.82%
This study
Oct 1-28, 2026, read Oct 30, 2026
4,849 uploads, 83 of the 100 most-subscribed channels, 1,000+ views
(likes + comments) ÷ views
Median channel: 0.82% on regular videos, 1.52% on Shorts
Dash Social adds shares, which only a channel's owner can see. Buffer divides by impressions, the times a post was shown, not the times it was watched. Trend Report and TubeStats use the same formula as this study but sample many more, smaller channels, and their windows reach back before August 24, 2026. All of them average or take medians over videos, so channels that post the most weigh the most, where this study counts each channel once. Measured the same way as Trend Report and TubeStats, the biggest channels' typical regular video comes in at about a third of their medians.
How to calculate your YouTube engagement rate
Pick the counts. In YouTube Studio, open the video's Analytics, or read the like and comment counts under the video.
Add likes and comments, then divide by views. 2,500 likes plus 150 comments on 100,000 views is 2,650 ÷ 100,000 = 0.0265.
Multiply by 100. That video's engagement rate is 2.65%.
Compare like with like. Compare Shorts with Shorts and regular videos with regular videos, from channels of a similar size.
Shares, saves and dislikes are visible only to the channel owner, so a public engagement rate can only use likes and comments. Using subscribers as the denominator instead of views gives a different number that measures something else: how much of your audience acts on each upload.
What this means if you publish video
Judge a rate against channels like yours. The biggest channels' typical video gets under 1%; benchmarks drawn from smaller channels on the same formula run about three times that. Compare Shorts with Shorts.
Expect lower rates on new uploads. Since August 24, 2026 every play counts as a view, so a rate below last year's on similar videos may reflect counting, not your audience.
Ask for the comment. Comments are a small part of engagement on big channels; a direct question or a pinned comment is how creators raise them.
Start a fresh baseline from late August 2026. Rates on videos posted before and after August 24 aren't comparable, so judge new uploads against each other.
Channels. Every channel in Wikipedia's list of the most-subscribed YouTube channels as listed on October 25, 2026. We counted every upload that our upload time study found in the four full weeks before October 29 in each channel's home time zone; that study's collection had missed Karla Bustillos (92nd), so we read her uploads the same way for this one. Channels that posted nothing in the four weeks, and eight TV and news networks that posted more uploads in a week than that study reads, are not included. That leaves 83 channels and 5,799 uploads, posted from September 30 to October 29, 2026 (UTC).
Counts. On Oct 30, 2026 we read each upload's view, like and comment counts, length, category and audience setting through the YouTube Data API. Every upload was still available. An upload counts toward the engagement rate when it had at least 1,000 views and public like and comment counts and was not set as made for kids: 4,849 did. Engagement rate is (likes + comments) ÷ views × 100.
Types. An upload is a Short or a live stream when YouTube lists it in the channel's Shorts or live playlist; everything else is a regular video, as in the upload time study.
Weighting. Channel figures use each channel's median upload of a type, for channels with at least 3 qualifying uploads of it, and then the median across channels. Category, view, age, length and country figures are medians over uploads. The calculator compares a video with each channel's typical video, so a rate at the typical channel's figure sits at the 50th percentile. The analysis scripts and the per-upload results are in the CSV files below and in this page's study folder. None of the channels reviewed or endorsed this study.
Limitations
The biggest channels, not all of YouTube. These channels lean toward music, entertainment and kids' content, many in India and the U.S.; benchmarks drawn from smaller channels run higher.
A single read. Each upload was read once, between one and thirty days after it went up (the newest about 33 hours after).
Public counts only. Shares, dislikes, saves and engaged views are visible only to channel owners, and YouTube may remove views, likes or comments it judges invalid after we read them.
Paid views count. Views from video ads that play the video count toward its public views, so a heavily promoted video's rate is lower.
Categories are the uploader's choice. YouTube categories are picked per video and are broad; many channels file everything under Entertainment.
Our measurements and the CSVs are free to reuse under CC BY 4.0 with a link to this page. The videos remain the property of the channels that published them.
We plan to rerun the check every six months on the same list. Corrections go to contact@markstudios.com.
Oct 30, 2026: First published: 4,849 uploads from 83 of the most-subscribed channels.
Oct 30, 2026: Corrected the same day: the like and comment ratios are now worked out from unrounded medians (1 like per 131 views and 1 comment per 2,833 on regular videos, 1 comment per 6,165 on Shorts; they had read 132, 2,857 and 6,250); the newest uploads were read about 33 hours after posting, so the age range starts at one day, not two; Bispo Bruno Leonardo posts prayer videos four times a day, not nightly; and channels Wikipedia lists under two countries now read “United States / China” in the table and CSVs.
Oct 30, 2026: The calculators now compare a video with each channel’s typical video, so a rate equal to the typical channel’s (0.82% for regular videos) sits at the 50th percentile; they had ranked it among individual uploads. The per-upload CSV gains a YouTube category column, and the per-channel CSV counts every video and Short with a rate, not only channels with three or more.
Every channel's engagement rate
All 60 channels
Rank
Channel
Country (Wikipedia)
Videos counted
Median video engagement
Shorts counted
Median Shorts engagement
1
MrBeast
United States
–
–
3
2.40%
2
T-Series
India
151
0.82%
43
1.12%
4
SET India
India
190
0.33%
76
1.18%
6
Stokes Twins
United States / China
–
–
3
0.95%
8
김프로KIMPRO
South Korea
–
–
79
0.77%
10
Alejo Igoa
Argentina
4
1.19%
6
2.00%
11
Zee Music Company
India
59
0.64%
136
1.13%
12
WWE
United States
122
1.55%
163
2.72%
13
Goldmines
India
173
0.28%
22
1.52%
15
Sony SAB
India
167
0.61%
97
1.80%
16
Alan's Universe
United States
–
–
14
1.16%
20
Topper Guild
United States
5
0.66%
21
1.34%
22
KL BRO Biju Rithvik
India
10
0.30%
37
1.08%
23
BANGTANTV
South Korea
6
7.02%
8
12.30%
25
ZAMZAM BROTHERS OFFICIAL
United Arab Emirates
–
–
152
1.70%
26
Mark Rober
United States
–
–
3
2.85%
28
T-Series Bhakti Sagar
India
108
0.69%
59
1.31%
30
Hybe Labels
South Korea
31
5.49%
51
10.46%
32
Tips Official
India
98
0.25%
66
0.84%
33
Zhong
United States / China
6
0.78%
29
1.39%
34
5-Minute Crafts
Cyprus
34
0.39%
–
–
35
Fede Vigevani
Mexico / Uruguay
8
2.76%
3
2.17%
37
Bispo Bruno Leonardo
Brazil
109
53.52%
10
11.84%
38
Anaya Kandhal
United States
–
–
18
0.89%
39
ISSEI / いっせい
Japan
–
–
6
1.30%
41
Shemaroo Filmi Gaane
India
49
0.53%
5
0.93%
43
Sony Music India
India
68
0.75%
33
1.18%
44
YRF
India
7
0.53%
31
1.35%
47
YOLO AVENTURAS
Mexico / Venezuela
13
1.60%
9
2.44%
48
Wave Music
India
53
0.32%
–
–
50
Canal KondZilla
Brazil
40
2.16%
–
–
51
Celine Dept
Belgium
–
–
51
1.41%
53
Movieclips
United States
287
0.55%
–
–
54
Dangal TV Channel
India
325
0.37%
–
–
55
Saregama Music
India
120
0.77%
–
–
57
Dude Perfect
United States
–
–
21
2.21%
58
MrBeast 2
United States
–
–
4
3.33%
60
PANDA BOI
Italy
–
–
7
0.81%
61
Shemaroo
India
57
0.27%
–
–
62
IShowSpeed
United States
–
–
10
3.19%
63
आचार्य प्रशान्त - Acharya Prashant
India
9
1.02%
453
4.09%
64
MrBeast Gaming
United States
–
–
3
2.02%
66
Alfredo Larin
El Salvador
3
2.59%
20
1.41%
71
Mikecrack
Spain
3
2.18%
3
3.93%
77
JuegaGerman
Chile
8
3.02%
–
–
78
shfa
United Arab Emirates
5
0.57%
–
–
80
Juan de Dios Pantoja
Mexico
4
1.59%
–
–
84
Jess No Limit
Indonesia
7
1.27%
11
1.82%
87
Shakira
Colombia
3
1.05%
–
–
88
T-Series Bollywood Classics
India
110
0.61%
–
–
89
Ishtar Music
India
35
0.55%
101
0.84%
90
LUCCAS NETO
Brazil
10
2.50%
–
–
91
MR. INDIAN HACKER
India
27
3.60%
–
–
92
Karla Bustillos
Mexico
4
2.13%
11
2.66%
93
Techno Gamerz
India
5
2.50%
–
–
95
Real fools shorts official
India
–
–
8
3.45%
96
Natan por Aí
Brazil
8
1.17%
20
2.92%
97
BEN EAGLE
Vietnam
–
–
242
0.97%
98
BETER BÖCÜK
Turkey
14
1.25%
14
1.23%
99
BeatboxJCOP
South Korea
–
–
12
1.97%
Frequently asked questions
What is a good engagement rate on YouTube?
Judged against the biggest channels, a regular video above 0.82% beats the typical channel and one above 2.15% puts it in the top quarter. Those figures come from 43 of the most-subscribed channels in October 2026, measured as likes plus comments per view on videos with at least 1,000 views. Benchmarks drawn mostly from smaller channels put the typical video at 2.2% to 2.6% on the same formula, so compare yourself with channels of your size and niche.
What is the average engagement rate on YouTube?
For the biggest channels, the typical regular video got 0.82% engagement (likes plus comments per view) in October 2026 and the typical Short 1.52%. Published benchmarks run higher, from about 2.2% to 4.4%, because they sample smaller channels, divide by impressions instead of views or count shares too, and most predate YouTube's August 2026 change to view counting.
How do you calculate YouTube engagement rate?
Add a video's likes and comments, divide by its views and multiply by 100. A video with 100,000 views, 2,500 likes and 150 comments has an engagement rate of 2.65%. Some tools also add shares, which only the channel owner can see, or divide by impressions or subscribers, so check which formula a benchmark uses before you compare.
Do YouTube Shorts get more engagement than videos?
On the biggest channels in October 2026, yes: their typical Short got 1.52% engagement against 0.82% for their typical regular video. That is despite Shorts views counting every play and replay with no minimum watch time, which pulls a Short's rate down. Compare Shorts with Shorts and videos with videos.
What is a good like-to-view ratio on YouTube?
About 1 like per 131 views is typical for a regular video from the biggest channels (7.6 likes per 1,000 views at the median channel, October 2026). Shorts from the same channels drew 1 like per 66 views. Likes make up almost all engagement: the typical big-channel video got about 22 likes for every comment.
How many comments per view is normal on YouTube?
About 1 comment per 2,833 views on a regular video from the biggest channels (0.35 per 1,000 views at the median channel in October 2026). Shorts drew 1 per 6,165 views. Videos set as made for kids get none, because YouTube turns comments off on them.
Why are YouTube engagement rates lower in 2026?
Partly because views are counted differently. Since August 24, 2026, YouTube counts a view the moment a video starts to play, including autoplay, across Shorts, long-form videos and live streams. More plays count as views while likes and comments don't change, so the same audience produces a lower engagement rate than it would have under the old count.
Can I use this data?
Yes. Our measurements and the per-upload and per-channel CSVs are free to reuse under CC BY 4.0 with a link to this page. The videos belong to the channels that published them; we publish only their public view, like and comment counts and links.