Every figure on this page links to the organization that produced it, and each was re-checked against that source before publishing. What 37 home-improvement YouTube channels posted in the past year (our own measurement), how big the U.S. trades are, what homeowners spend on improvements and who they hire, how they find and vet a pro, how people use how-to video, and where the popular contractor marketing numbers came from.
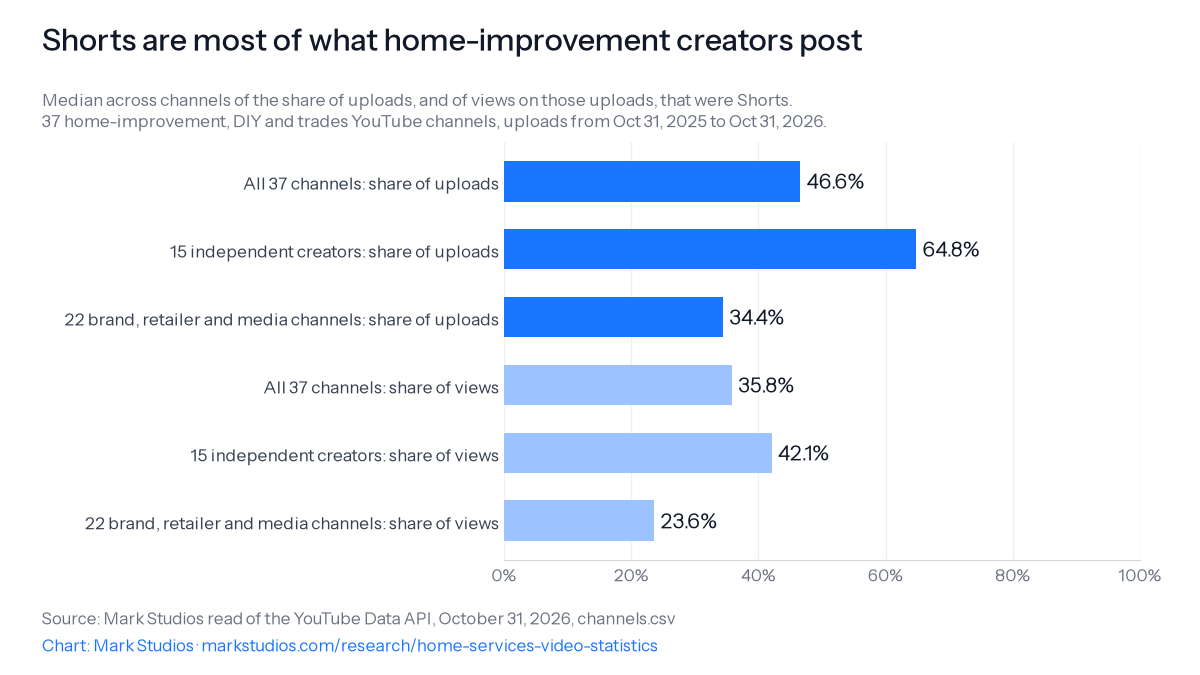
Shorts were 46.6% of the median home-improvement YouTube channel's uploads in the year to October 31, 2026: 64.8% for independent creators and 34.4% for brand, retailer and media channels. (Our measurement)See details
Independent home-improvement creators posted 1.75 videos a week against 0.88 for brands, and had a median of 358,000 subscribers against 12,590. (Our measurement)See details
Only 12.2% of the channels' regular videos had chapters and 22.8% had captions uploaded by the channel. (Our measurement)See details
Harvard's Joint Center for Housing Studies projects U.S. homeowner improvement and repair spending of about $525 billion a year through Q3 2027, growing just 1.5 percent. (Harvard JCHS)See details
Professionals installed 84.1 percent of owner improvement spending in 2023, a record; DIY spending fell to $64 billion. (Harvard JCHS)See details
1,986,549 U.S. specialty trade businesses had no employees in 2024, about 3.8 for every one of the 521,315 trade establishments with a payroll (2023). (U.S. Census Bureau; our calculation)See details
BLS projects HVAC mechanics to grow 10.9 percent and electricians 9.2 percent over 2025-35, against 3.5 percent for all jobs. (U.S. Bureau of Labor Statistics)See details
97% of U.S. consumers read reviews for local businesses and 47% won't use one with fewer than 20, while 45% now use AI tools for local recommendations (BrightLocal 2026 survey). (BrightLocal)See details
68% of U.S. homeowners expect photo or video proof of completed work from a home-service pro (Housecall Pro survey, October 2025). (Housecall Pro)See details
Angi's service requests fell 10% to 15,543,000 in 2025 and its average monthly active pros fell 19% to 122,000. (Angi 10-K)See details
Google Business Profile videos can run up to 30 seconds, so a profile takes short clips, not full project films. (Google)See details
What do home-improvement YouTube channels actually post?
Mostly Shorts. In the 12 months to October 31, 2026, Shorts made up 46.6% of the median channel's uploads in our read of 37 home-improvement, DIY and trades channels, and 63.6% of all 4,846 uploads pooled. We drew the channels from Wikipedia's do-it-yourself categories, Wikipedia's list of U.S. home improvement retailers and Feedspot's home improvement YouTubers list, kept those with at least 12 uploads in the year and at least half of them on topic, and read every upload through the YouTube Data API on October 31, 2026. The per-channel and per-video data is published in channels.csv and videos.csv.
Shorts are most of what home-improvement creators postMedian across channels of the share of uploads, and of views on those uploads, that were Shorts. 37 home-improvement, DIY and trades YouTube channels, uploads from Oct 31, 2025 to Oct 31, 2026.
Independent creators and brands behave differently. Shorts were 64.8% of the median independent creator's uploads against 34.4% for the median brand, retailer or media channel. Creators also posted more often, 1.75 videos a week against 0.88, and had far bigger audiences: a median of 358,000 subscribers against 12,590. Across all 37 the median channel posted 1.21 videos a week and had 120,000 subscribers.
Shorts were common but not universal: 32 of the 37 channels posted at least one, and Shorts were more than half the uploads on 18. They drew 35.8% of the median channel's views on uploads from the year: 42.1% for creators and 23.6% for brands. The median Short ran 48 seconds.
Median across channels
All 37
15 creators
22 brands and media
Typical regular (non-Short) video, minutes
7.15
9
4.8
Likes per 1,000 views on regular videos
14.95
18.2
12.3
Pooled, the median regular video ran 10.25 minutes. Few channels use the features that make long videos easier to navigate and watch with the sound off: 12.2% of regular videos had chapters and 22.8% had captions uploaded by the channel, and both were concentrated in a handful of channels. 125 of the regular videos ran 60 seconds or less, mostly ad spots filed as ordinary uploads. Sponsorship is a creator habit: 10 of the 15 creators used YouTube's paid-promotion label at least once, and 14.3% of creator uploads carried it.
The sample is a convenience frame from public lists, not a ranking of the biggest channels, and it includes channels from outside the U.S. One retailer channel's 31-second TV spots account for most of the sample's raw views, so the page reports medians across channels rather than pooled view shares.
How big is the U.S. home-services trade?
The U.S. had 521,315 specialty trade contractor establishments with paid employees in 2023, according to the U.S. Census Bureau's County Business Patterns, employing 4,986,759 people with $356.9 billion in annual payroll. Specialty trades (NAICS 238) are the electricians, plumbers, HVAC, roofing, drywall, painting, flooring and other contractors who do most home-service work; the count includes firms that work on commercial buildings too. The 2022 Economic Census put their revenue at $1.28 trillion.
Trade (NAICS)
Employer establishments, 2023
Paid employees, March 2023
Businesses with no employees, 2024
Electrical contractors (23821)
83,342
1,015,983
171,644
Plumbing, heating and air-conditioning (23822)
111,207
1,214,761
189,085
Roofing contractors (238160)
25,519
—
—
Building finishing: drywall, painting, flooring, tile (2383)
—
—
678,091
Services to buildings and dwellings (5617)
227,045
—
1,911,817
Landscaping services (56173)
117,969
—
537,970
Most trade businesses are one person. Census's Nonemployer Statistics counted 1,986,549 specialty trade businesses with no paid employees in 2024, 1,802,156 of them sole proprietorships, with $144.3 billion in receipts. That is about 3.8 no-employee businesses for every employer establishment, averaging about $72,639 in receipts each (our calculation; the two counts use different units and years). In the 2022 Economic Census, plumbing and HVAC contractors reported $297.6 billion of revenue, services to buildings $226.0 billion and landscaping $115.4 billion.
Who does the work, and what it pays
The Bureau of Labor Statistics counted 757,220 electricians on payrolls in May 2025, at a median wage of $63,190. Its Occupational Employment and Wage Statistics exclude the self-employed, who held 25.1% of carpentry jobs, 31.3% of painting jobs and 19.8% of roofing jobs in 2025 BLS Employment Projections.
BLS projects 3.5% growth for all occupations over 2025-35 Employment Projections, released August 2026, so HVAC and electrical work grow fastest of the trades here. In BLS's Quarterly Census of Employment and Wages, private specialty trade contractors averaged 5,208,070 workers in 2025 at an average pay of $78,821; services to buildings paid an average of $44,319.
The residential side is softening. Specialty trade employment was 5,279.9 thousand in September 2026 (seasonally adjusted, preliminary) in BLS's Current Employment Statistics, higher than a year earlier, but residential specialty trade employment fell to 2,340.3 thousand, down 1.2% (our calculation).
What the software vendors see
ServiceTitan's FY2026 10-K reports about 10,800 active customers, trades businesses it bills more than $10,000 a year, and $82.1 billion invoiced through its platform in the year to January 31, 2026. In its 2024 IPO prospectus it estimated U.S. and Canadian trades spending at about $1.5 trillion a year, of which the trades it served were about $650 billion; the estimate rests on the company's own analysis. Jobber, which says it serves over 100,000 service businesses, reported median revenue at its landscaping and lawn-care customers up 13.8% year over year in April 2026, and online payments' share of transactions up 6% year over year in Q2 2026. Both sell software to the trades and report on their own customers, not the whole market.
How much do homeowners spend on improvements and repairs?
About $525 billion a year: that is where Harvard's Joint Center for Housing Studies projects U.S. homeowner spending on improvements and repairs to hover through the third quarter of 2027 in its October 2026 Leading Indicator of Remodeling Activity, with year-over-year growth of just 1.5 percent. Three months earlier the July 2026 release projected $519 billion and growth slowing to 0.5 percent, so the market is flat rather than falling.
The totals differ by what they count. Spending on owner-occupied and rental homes together rose to $611 billion in 2022 and is expected to have stayed above $600 billion through 2025 JCHS, Improving America's Housing 2025. Owner improvements alone, the Census construction-spending measure, were $376 billion in 2025 and grew 153 percent over the ten years to 2025 JCHS, State of the Nation's Housing 2026. JCHS's own estimate from the American Housing Survey put owner improvements at $405 billion in 2023, with another $105 billion on maintenance.
Measure
Covers
Value
LIRA projection, Oct 2026 (JCHS)
Owner-occupied improvements and repairs, four quarters to Q3 2027
29.7 percent of homeowners did at least one improvement project in 2023, and improvement spending averaged $4,700 per owner across all homeowners JCHS. The 2023 American Housing Survey counted 51.6 million owners who made improvements over 2021-2023, with a median spend of $6,500. Old houses drive the work: the median owner-occupied home was 42 years old in 2023, and the whole housing stock's median age was 44 years.
Replacements of worn-out systems, such as roofs, windows and HVAC, were 49 percent of 2023 owner improvement spending; discretionary remodels such as kitchens, baths and additions were 30 percent; outside projects 15 percent. Kitchen remodels were 10.1% of spending. Disaster repairs averaged $23 billion a year in 2021-2023, and projects affecting energy use reached $139 billion in 2023.
Project type, 2021-2023 (American Housing Survey)
Owner spending
Roofing
$93.5 billion
Kitchen remodels
$83.1 billion
HVAC
$82.4 billion
Bathroom remodels
$68.9 billion
Doors and windows
$45.2 billion
Landscaping and sprinklers
$26.6 billion
The median kitchen remodel cost $8,000 in the survey, across all project sizes. Big spenders dominate the dollars: owners spending $50,000 or more were 44 percent of the 2023 market, and owners 65 and over were 27 percent of spending, up from 14 percent in 2003. Owners who bought in the past three years spent an average of $6,600 in 2023; the highest-income fifth of owners spent $10,900 on improvements and maintenance. Owners of homes built before 1940 spent $6,700.
Professionals do almost all of it
Professionally installed projects were 84.1 percent of owner improvement spending in 2023, a record share; DIY spending fell to $64 billionJCHS. Owners 65 and over put more than 88 percent of their improvement dollars into professional work. The typical DIY project cost $2,600. By project count DIY matters more: about 50 million of 140 million projects in 2021-2023 were done by homeowners themselves American Housing Survey. The number of general remodelers with payrolls rose to 125,000 in 2023. Home equity paid for 15 percent of kitchen and bath remodel spending.
In the Houzz & Home Study, a survey of 20,358 Houzz users fielded January to March 2026 by a company that sells to renovation pros, 91% of renovating homeowners hired at least one professional for 2025 projects. Specialty trades hired directly (electricians, plumbers, HVAC, painters, carpenters) were the most common, at 48%; general contractors 29%; construction professionals of any kind (general contractors, builders, design-build firms, kitchen and bath remodelers) 41%. 54% of the homeowners in the study renovated, with a median spend of $20,000 in 2025 and a planned $15,000 for 2026; the 90th percentile was $150,000, and 31% spent $50,000 or more. Kitchens had the highest median, $24,000; a major remodel of a large kitchen ran $55,000; primary baths $15,000 and roofing $13,000. 37% went over budget, and kitchen projects averaged 9.5 months of planning. Houzz users skew toward bigger projects than the American Housing Survey's whole population of owners, which is why its medians are higher.
Remodelers themselves read the market as positive but leads as slow. NAHB's Remodeling Market Index was 62 in Q3 2026 (above 50 means more remodelers call conditions good than poor), but its leads-and-inquiries component was 53, the weakest of the five. Bathroom remodeling was the most common job for NAHB remodelers in 2025: 73% called it common or very common.
How do homeowners find and vet home-service pros?
Through reviews, mostly. 97% of U.S. consumers read online reviews for local businesses, according to BrightLocal's 2026 Local Consumer Review Survey of 1,002 U.S. adults (BrightLocal sells local-search software and does not state its field dates). 41% always read them, up from 29% a year earlier, and the average consumer uses 6 review sites. Recency and volume matter: 74% only care about reviews from the last three months, 47% won't use a business with fewer than 20 reviews, and 31% will only use one rated 4.5 stars or higher. 85% are more likely to use a business after positive reviews, and 89% expect owners to respond. Where people look is moving: Google's share as a review source fell to 71% from 83%, while using ChatGPT and other AI tools for local recommendations rose to 45% from 6%.
Homeowners also expect to see the work. In a Housecall Pro survey of 1,040 U.S. homeowners in October 2025 (Housecall Pro sells software to home-service businesses), 68% said they expect photo or video proof of completed work, nearly 60% appreciate seeing the technician's name and photo before a visit, and 96% expect a professional website. 80% factor in online booking, over 70% would pay more for a pro with a better reputation, 73% would refer a business after excellent service and 53% are comfortable with AI handling first inquiries.
What the lead marketplaces report
Company (FY2025 10-K unless noted)
Figure
Angi: service requests
15,543,000, down 10%
Angi: leads (consumer-to-pro connections)
20,195,000, down 17%
Angi: average monthly active pros
122,000, down 19%
Angi: new pros onboarded
90,000
Yelp: Services advertising revenue
$947.6 million, up 8%
Yelp: paying Services advertising locations
257,000
Nextdoor: weekly active users, Q4 2025
21.0 million, down from 22.2 million
Frontdoor: home warranty service requests a year
3.8 million, through 17,000 contractor firms
Thumbtack (company site, undated)
300,000+ pros, 90 million+ projects started
The marketplaces are shrinking on the pro side. Angi reported $1.03 billion in 2025 revenue, down 13%, and its U.S. network revenue fell 72% after it began letting homeowners choose which pro to contact in January 2025; fees for consumer matches were still $587.1 million. That works out to about 166 leads a year per average monthly active pro (our calculation). Yelp's Services ad growth came with a 9% rise in cost per click. Nextdoor says it reaches 1 in 3 U.S. households and counts 105 million verified neighbors to date in 350,000 neighborhoods across 11 countries; Pew Research Center found 18% of U.S. adults used Nextdoor in 2026. Frontdoor's preferred contractors completed 84 percent of its requests, and it held 2.11 million warranties at a 79.2% retention rate. Thumbtack lists 500+ categories and 12 million+ five-star reviews. All of these are company-reported.
Google's rules for local service ads and profiles
Google ranks Local Services Ads on profile quality, which it bases on rating, number of reviews, response time and other signals, and recommends 5 or more reviews; some business types need five before the ad shows. It charges for a missed call if the caller stays on more than 20 seconds, does not charge again for the same customer within 15 days, and recommends a budget of at least 10 leads per week. Accounts can hold up to 100 photos. The Google Guarantee money-back program is gone: Google moved to a single Google Verified badge and limited claims to services booked before December 7, 2025Google. Accelerated verification gives 14 days to finish the checks, and a business denied twice waits 180 days to reapply.
On a Google Business Profile, videos can run up to 30 seconds and 75 MB at 720p or higher, so a profile takes short clips, not full project films.
Fake reviews and scams
The FTC's rule on consumer reviews and testimonials took effect on October 21, 2024. It bans buying reviews conditioned on their sentiment (16 CFR 465.4) and suppressing reviews by threats (465.7) eCFR, and a knowing violation can cost up to $53,088 per violation 16 CFR 1.98.
Home improvement is a fraud category consumers report often. Consumers filed 81,925 home improvement, repair and solar reports with the FTC's Consumer Sentinel Network in 2024, down from 95,198 in 2022, plus 20,360 about home warranties. In BBB Scam Tracker data for 2025, from more than 146,000 reports, home improvement scams had a median loss of $1,405, 69.1% of reports involved a loss, and the costliest tenth had a median loss of $14,050.
How do people use video for home projects?
As a manual. In Pew Research Center's 2018 survey, 51% of U.S. YouTube users said the site is very important for figuring out how to do things they haven't done before, and 87% said it is at least somewhat important; the very-important group equalled 35% of all U.S. adults. The share was 53% among users aged 18 to 29 and 41% among those 65 and older. 54% said YouTube matters for their purchase decisions. Pew has not repeated the question since 2018.
YouTube is the default video platform for Americans. Pew's 2026 survey found 84% of U.S. adults use YouTube, up from 73% in January 2018, against 37% for TikTok. Use runs from 95% of adults 18 to 29 to 65% of those 65 and older, an age group whose share of owner improvement spending reached 27 percent in 2023. In early 2025, 33% visited YouTube several times a day and 24% used TikTok daily Pew; TikTok use was 37% in 2025, up from 21% in 2021, while YouTube was at 84%Pew.
What Google measured about DIY video
Google's own research on DIY video is old but specific. In a 2013 study of DIY shoppers, 49% had watched online video for their project and 65% said they would be more likely to buy from a retailer or brand that offered DIY videos Think with Google. In Canada in 2016, 62% of DIYers watched instructional videos before or during a project, 1 in 4 followed along on a phone, and only 7% rated themselves at a professional skill level Think with Google Canada. In 2015, how-to searches on YouTube were growing 70% a year in the U.S., and North Americans had watched more than 100 million hours of how-to video that year Think with Google. Watch time of U.S. YouTube videos with home renovation in the title grew more than 200% from July 2017 to June 2018 Google.
Other Google figures from the same era: 67% of U.S. millennials (aged 18 to 34) said they can find a YouTube video on anything they want to learn and nearly one in three had bought something after a how-to video (2015); more than 7 in 10 U.S. YouTube viewers aged 18 to 54 used it for help with a problem in their work, studies or hobbies, and 86% regularly used it to learn something new (2017) Think with Google. Among U.S. video viewers aged 18 to 54, women were 50% more likely than men to watch how-to videos regularly Google/Ipsos, 2016. Learning content drew 500 million views a day in 2017, and 4 in 5 people said video helps them learn Think with Google. In a 2017 diary study of 18,219 viewing occasions, how-to videos earned the most attention of any category Google/Ipsos. All of these are Google measuring its own platform.
What YouTube and TikTok say now
YouTube says U.S. learning and how-to videos drew more than 5.5 billion views in June 2025 alone, and that renovation channel Mr. Kate earned over 400 million views worldwide on home renovation videos in the first half of 2025 YouTube Culture & Trends. On its press page in October 2026, YouTube counts more than 20 million uploads a day, with Shorts averaging over 200 billion daily views YouTube, and it says it has been #1 in U.S. streaming watch time for nearly three years, citing Nielsen YouTube. Its older figure of 500 hours uploaded every minute was retired from the press page in mid-2025 archived press page.
TikTok said its #CleanTok community had over 78 billion views in June 2023 and 79 billion in May 2024 TikTok for Business, a snapshot of views to date. It tells advertisers that 57.6% of its users call themselves home and lifestyle enthusiasts TikTok for Business, and in a TikTok-commissioned Kantar study of shoppers in Asia-Pacific, 82% of its homecare shoppers used the app daily TikTok. The Home Depot sells online too: online sales were 15.9% of net sales in fiscal 2025, up from 15.1%Home Depot 10-K.
In the UK, Ofcom found YouTube reached 94% of online adults in May 2025, for an average of 51 minutes a day, and 39% of children aged 3 to 17 watch tutorials for hobbies.
When DIY video goes wrong
Copied videos can be dangerous. Fractal wood burning, a technique spread by YouTube videos, puts upwards of 20,000 volts through wet wood; in a 2020 case series University of Michigan surgeons described four patients electrocuted copying it Journal of Burn Care & Research, noting that the American Association of Woodturners cited more than 24 deaths. An emergency-medicine report counted 34 injuries in news reports since 2016 JACEP Open, and a 2025 forensic review put recorded deaths at 35, most of them men in the United States Forensic Science, Medicine and Pathology. A UK review of 148 YouTube DIY home videos uploaded from 2015 onward found 85.1% showed inadequate eye protection and 73.6% showed none throughout; 42.6% came from channels with over a million subscribers Eye News, a trade magazine.
What the popular contractor marketing numbers really say
Contractor-marketing agencies and field-service software blogs repeat a small set of figures. We traced each to the organization that first published it, using exact-phrase searches for the figure and its older wordings, Internet Archive captures of the vendors' pages and blogs, and trade press of the period. Most began as a narrower measurement than the one now quoted, and a few have no origin we could find.
"Homeowners are more likely to hire a contractor with video"
The figure behind it is a self-reported preference from a lead seller. In April 2022 Service Direct, which sells leads to contractors, surveyed 559 U.S. homeowners on SurveyMonkey and reported that 59% said they are more likely to hire a contractor whose website has videos. That is what people said, not what they did. The same firm's survey of 614 consumers about small businesses in general gave 50%Service Direct. Plumbing-marketing pages repeat the 59% correctly (59%, Webtonic). Other versions have no source: a contractor-website page claims 78% of homeowners feel more confident after watching project videos, citing a 2025 study we could not find rudys.ai. Scorpion, an agency that sells video packages, says nearly half of homeowners hesitate to contact a business with no video, 60% under 45, and reports 29% organic lead growth for its own video clients, without publishing a sample for either; in its survey of 2,000 homeowners, 69% said they would think twice about a business using stock imagery. Use instead: the 68% of homeowners in a 2025 Housecall Pro survey who expect photo or video proof of finished work, labelled as a vendor survey.
"97% of consumers search online for local businesses"
The oldest version is from 2010. BIA/Kelsey and ConStat reported that 97% of consumers used online media when researching local products or services, from an online survey of 1,002 people in February 2010, so everyone asked was already online. Trade press at the time described it as covering internet users (97 percent, Chief Marketer). BrightLocal's 2017 survey then found 97% had searched online for a local business in the past year; its later readings were 90% (2019), 93% (2020), 99% (fielded November 2021) and 98% (fielded January 2023) (BrightLocal 2019, 2020, 2022 edition, 2023 edition). Repeaters attach wordings no source used: "before making a purchase decision" (97%, FieldCamp), "97% in 2020" when the 2020 figure was 93% (97%, Workiz), and a "HubSpot" version about learning more online than anywhere else (97%, HackerNoon). The same Workiz post says customers are 40% more likely to hire whoever answers first, with no source. BrightLocal's current 97% (97%, 2026 survey) is a different question: how many read reviews. 41% always read them, and the reading share was 87% in 2020 BrightLocal 2020. A tracking vendor's claim that the Google LSA badge earns 13.2% more clicks, credited to LocaliQ, has no source we could find PipelineOn, and Local Services Ads charge per lead, not per click. Use instead: BrightLocal's dated readings above, with their question.
"Estimates with video close 40% faster"
It blends two numbers from a proposal-software vendor. Proposify said proposals with video close 41% more often and 26% faster, from 1,026,891 proposals sent in 2021 across all industries, and estimate-software pages repeat it (41%, Agiled). Its 2026 data on 742,137 proposals says a proposal is 3.3x more likely to close when the buyer watches the video, which shows engaged buyers watch, not that video caused the sale. In the same data, construction proposals closed at 21% against 34% overall Proposify. No source says contractor estimates close 40% faster.
"86% of homeowners use YouTube for DIY"
The 86% is not about homeowners. It comes from Google's 2017 Values of YouTube study of U.S. consumers aged 18 to 54: 86% of U.S. viewers said they often use YouTube to learn new things Think with Google. Homeowner surveys do exist, from home-warranty companies: American Home Shield found 77% of 993 homeowners use social media for DIY repairs (November 2024), and Frontdoor found 73% of 1,003 homeowners turn to YouTube when a project goes wrong (November 2024). Repeaters garble the first: a radio report turned it into 77% who search Google or YouTube first WSB, and a Realtors blog adds that 87% of them choose YouTube, which is not on American Home Shield's page Pennsylvania Association of Realtors. For the general population, Pew's 51% (2018) is the independent figure.
"Video on a landing page lifts conversions 80%"
It began as one client's test. EyeView, which sold landing-page video, reported in November 2009 that its first test for one client, a tutoring company, boosted conversion by over 80%; its 2010 white paper called over 80% a best case "in some cases" EyeView. By 2015 tech press presented it as a rule (80%, Tech.co), and contractor marketers still do in 2026 (80%, PipelineOn; 80%, CI Web Group). When Unbounce compared about 35,000 of its customers' landing pages per period in 2020-21, pages with video converted about as well as or slightly worse than pages without. The same trace appears in our fact-check.
"Home services is a $657 billion market"
It is a 2022 model, not measured revenue. Angi's July 2022 Economy of Everything Home report estimated U.S. household spending on home projects at $657 billion, of which $475B was home improvement; its 2021 edition said $595BAngi. We found no later edition. Agency pages still present $657 billion as this year's market Hook Agency, or say it has been surpassed ($657 billion, Amenify), and TechCrunch's $600 billion in 2023 has no source TechCrunch. Use instead: Harvard JCHS's measured series, about $525 billion a year of owner improvement and repair spending through Q3 2027 (October 2026); its January 2026 release projected $518 billion for the end of 2026.
We started from the questions people search for about home services video statistics and looked for the organization that actually produced each answer. Every figure on this page sits in an evidence ledger with its source, the exact table or paragraph it came from, the measurement period, the population measured, and the date we checked it. This edition holds 320 figures from 47 publishers.
On October 31, 2026, each of the sourced figures on this page was re-fetched with the fetch cache cleared and matched against the recorded wording: Census counts through the Census data API (linked here to the matching data.census.gov tables), BLS wages through the BLS data API and QCEW open data, company figures from SEC filings on EDGAR, and pages that refuse scripts (bls.gov, ftc.gov, ofcom.org.uk, getjobber.com, older Think with Google pages) through dated Internet Archive captures. Our own figures come from a YouTube Data API read of 37 home-improvement channels on October 31, 2026; the per-channel and per-video data is published in channels.csv and videos.csv. We left out Angi's State of Home Spending figures (its report would not load and its releases give no sample size or field dates), Home Improvement Research Institute figures we could only see quoted on an Angi help page, and Census's monthly breakdown of improvement spending, which is published only as spreadsheets.
We only cite the producer: government agencies, regulators, company filings and official posts, and the survey owner's own report. We do not cite statistics roundups, Statista-style aggregators, or salary sites without a public method. We did not bypass paywalls or sign-up forms; where a full report was gated, we used only the figures its publisher states publicly.
Figures marked "our calculation" are arithmetic on the cited numbers, and anyone can reproduce them:
This edition contains no Mark Studios customer data.
Limitations
Our channel sample is a convenience frame. Wikipedia and Wikidata list few home-improvement creators, so the 37 channels come from Wikipedia categories, Wikipedia's list of U.S. home improvement retailers and a list published by Feedspot, a vendor. It is not a ranking of the biggest channels, it includes channels outside the U.S., and topic was judged by one reader from video titles.
Medians, not pooled views. One retailer channel's short TV spots account for most of the sample's raw views, so the page reports medians across channels. Shorts are counted from each channel's Shorts playlist; some short horizontal clips sit outside it.
Spending totals measure different things. JCHS's LIRA covers owner-occupied homes; its Improving America's Housing totals add rental properties; the Census construction-spending figure counts owner improvements only; the American Housing Survey covers two years. The page keeps them apart.
Trade counts mix home and commercial work. Census and BLS classify by trade, not customer, so electricians and plumbers who wire offices are counted with those who fix homes. Employer establishments and nonemployer businesses are different units from different years.
Several figures come from parties with a stake. Houzz, BrightLocal, Housecall Pro, Jobber and ServiceTitan sell to contractors; Angi, Yelp, Nextdoor, Thumbtack and Frontdoor report on their own marketplaces; Google, YouTube and TikTok report on their own platforms.
Some video figures are old. Pew last asked about YouTube for learning in 2018, and most of Google's DIY research dates from 2013 to 2018. They are labelled with their year.
How to cite this page
For a single figure, cite the original publisher named next to it, and link here if the verification trail is useful to your readers. Each figure has its own anchor, so you can link straight to it, for example https://www.markstudios.com/research/home-services-video-statistics#DRV-004. To cite the page as a whole:
Mark Studios. "Home Services Video Statistics." Last verified Oct 31, 2026. https://www.markstudios.com/research/home-services-video-statistics
APA
Mark Studios. (2026, October 31). Home services video statistics. https://www.markstudios.com/research/home-services-video-statistics
MLA
“Home Services Video Statistics.” Mark Studios, 31 Oct. 2026, www.markstudios.com/research/home-services-video-statistics.
Chicago
Mark Studios. “Home Services Video Statistics.” Last modified October 31, 2026. https://www.markstudios.com/research/home-services-video-statistics.
BibTeX
@misc{markstudios_home_services_video_statistics_2026,
  author = {{Mark Studios}},
  title = {{Home Services Video Statistics}},
  year = {2026},
  month = oct,
  url = {https://www.markstudios.com/research/home-services-video-statistics},
  note = {Last verified 2026-10-31}
}
Our calculations and the evidence table are free to reuse with attribution and a link to this page. Each underlying figure remains the claim of its original publisher, and some publishers ask for a link when their figures are reused.
We re-verify every figure quarterly and when a major source publishes a new edition. The next scheduled review is January 2027. Corrections go to contact@markstudios.com.
Oct 31, 2026: First published with 320 figures from 47 publishers, each checked against its original source.
Oct 31, 2026: Corrected the same day: JCHS's $4,700 is average improvement spending per owner across all homeowners, not per owner with a project; ServiceTitan's active customers are businesses it bills more than $10,000 a year; Houzz's 41% covers all construction professionals and its 54% is a share of the homeowners surveyed; Nextdoor's 105 million verified neighbors are a running total across 11 countries; Pew's YouTube use was 84% in 2025 after 85% in 2024, so it did not hold steady; JCHS reports owners 65 and over at 27 percent of improvement spending, not that they spend the most; the $611 billion now cites Improving America's Housing 2025 and the $376 billion and 153 percent cite State of the Nation's Housing 2026; age, place, year and year-over-year qualifiers added to Google's millennial figure, the fractal wood burning deaths, the 2026 agency claims, Mr. Kate's worldwide views and Jobber's online payments; travel for shoots outside Palm Beach, Broward and Martin counties is quoted per trip.
Frequently asked questions
Do home-improvement YouTube channels post Shorts or long videos?
Both, but mostly Shorts. In our read of 37 home-improvement, DIY and trades channels for the year to October 31, 2026, Shorts were 46.6% of the median channel's uploads and 64.8% of the median independent creator's. The median channel's typical regular video ran 7.15 minutes, and the median Short 48 seconds.
How much do Americans spend on home improvement?
Harvard's Joint Center for Housing Studies projects homeowner spending on improvements and repairs of about $525 billion a year through the third quarter of 2027. Homeowners who made improvements spent a median of $6,500 over 2021-2023 in the American Housing Survey.
Do homeowners hire professionals or do it themselves?
Mostly professionals by dollars: professionally installed projects were 84.1 percent of owner improvement spending in 2023. By count, about 50 million of 140 million projects in 2021-2023 were DIY.
How many contractors are there in the U.S.?
Census counted 521,315 specialty trade contractor establishments with paid employees in 2023 and 1,986,549 specialty trade businesses with no employees in 2024. BLS counted 757,220 electricians on payrolls in May 2025.
Do homeowners want to see video from contractors?
In a Housecall Pro survey of 1,040 U.S. homeowners in October 2025, 68% said they expect photo or video proof of completed work. Pew found in 2018 that 51% of U.S. YouTube users called the site very important for learning to do things they haven't done before.
How long can a Google Business Profile video be?
Up to 30 seconds and 75 MB, at 720p or higher, according to Google's Business Profile help pages.
How many consumers read reviews before hiring a local business?
97% read online reviews for local businesses in BrightLocal's 2026 survey of 1,002 U.S. adults, and 74% only care about reviews from the last three months.
Is it true that 97% of consumers search online for local businesses?
It is an old and narrow figure. BrightLocal found 97% had searched online for a local business in its 2017 survey, but 90% in 2019 and 93% in 2020. The oldest version, BIA/Kelsey's 97% from 2010, came from an online survey, so everyone asked was already online.