Every figure on this page links to the organization that produced it, and each was re-checked against that source before publishing. How much of retail is sold online in the U.S. and elsewhere, what the big online sellers report and spend on advertising, what each marketplace allows for product video, what the platforms say video does to sales, how big social and live shopping are by the platforms' own numbers, how shoppers use video and reviews, the rules on reviews and testimonials, and which popular ecommerce video statistics don't hold up.
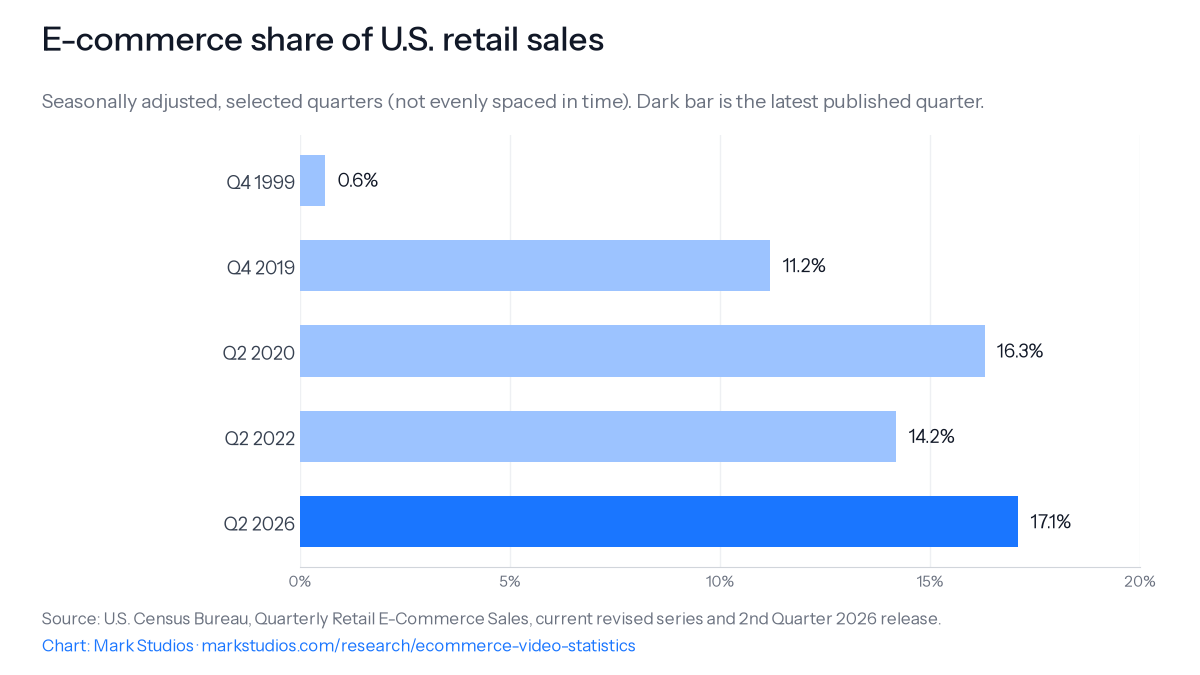
E-commerce was 17.1% of U.S. retail sales in the second quarter of 2026, $340.2 billion seasonally adjusted, the highest share in the Census series so far. (U.S. Census Bureau)See details
The share was 0.6% in late 1999 and 11.2% just before the pandemic, and it jumped to 16.3% when stores closed in 2020. (U.S. Census Bureau)See details
Great Britain sells 28.8% of retail value online and China 26.1% of consumer goods sales; Canada's share is 7.5%. (ONS; National Bureau of Statistics of China; Statistics Canada)See details
BLS counts 240 film and video editors among 15,503,410 U.S. retail jobs; retailers commission video far more than they staff it. (U.S. Bureau of Labor Statistics)See details
Amazon's advertising revenue was $68,635 million in 2025, 9.6% of its net sales. No retailer's annual report puts a number on video. (Amazon 10-K; our calculation)See details
Product video limits run from 12 minutes on Amazon listings to 3-15 seconds without sound on Etsy. (Amazon; Etsy)See details
Amazon says a listing's first shoppable video lifts sales 24% on average and that video can cut returns 40%, from internal data it does not publish. (Amazon)See details
Whatnot's $8 billion of 2025 live sales, the only dollar total any live-shopping platform publishes, equals at most 0.65% of U.S. e-commerce. (Whatnot; our calculation)See details
Social media drove 4.6% of Adobe-tracked online holiday revenue in 2025; affiliates, which include influencers, drove 20.4%. (Adobe)See details
NRF estimates 19.3% of 2025 U.S. online sales were returned, against 15.8% of all retail sales. (NRF and Happy Returns)See details
The popular '2.6x more time on pages with video' is Wistia measuring its own website, 2013 to 2016; Wistia's own rerun found 1.4x. (Wistia)See details
McKinsey's 'conversion rates approaching 30 percent' for live commerce has no footnote; the article's figure behind it is 28% for Taobao's top accounts in November 2020. (McKinsey & Company)See details
The FTC's rule against fake reviews and testimonials, video included, has applied since October 21, 2024, with penalties up to $53,088 per violation. (Federal Trade Commission)See details
How much of U.S. retail is sold online?
E-commerce was 17.1% of U.S. retail sales in the second quarter of 2026, seasonally adjusted: $340.2 billion out of $1,986.5 billion (U.S. Census Bureau, Quarterly Retail E-Commerce Sales, 2nd Quarter 2026). Online sales were up 12.2% on a year earlier, against 6.7% for all retail. Before seasonal adjustment the quarter's e-commerce came to $329.5 billion, 16.4% of sales. The Census Bureau counts an order as e-commerce when it is placed or its terms are agreed online, whatever the payment method, and it revises the series, so the second-quarter 2026 figures will be restated in a later release.
For 2025 as a whole, U.S. retail e-commerce came to $1,233.7 billion, or 16.4% of retail sales, up 5.4% on 2024 while total retail grew 3.5% (Census Bureau, 4th Quarter 2025 release). The share peaks every holiday season: in the fourth quarter of 2025, before seasonal adjustment, e-commerce was 18.3% of retail sales ($365,160 million of $1,999,440 million) (Census Bureau).
The long series shows how slowly the share moves outside the pandemic. Census's first quarter, the fourth quarter of 1999, put e-commerce at 0.6% of retail sales. It reached 11.2% in the last quarter before the pandemic, jumped to 16.3% in the second quarter of 2020 when stores closed, fell back to 14.2% by the second quarter of 2022, and has climbed since (Census Bureau, adjusted e-commerce series). The second-quarter 2026 share is 5.9 percentage points above the pre-pandemic quarter (our calculation).
E-commerce share of U.S. retail salesSeasonally adjusted, selected quarters (not evenly spaced in time). Dark bar is the latest published quarter. Census revises past quarters.
Seasonally adjusted, current revised series. Source: U.S. Census Bureau. Census revises past quarters, so a figure printed in an older release can differ from the series today.
Census's two e-commerce surveys disagree slightly for 2024. The quarterly series puts e-commerce at 16.1% of retail sales that year (Census Bureau, quarterly series). The Annual Integrated Economic Survey, which counts the total sales of retail employer firms, puts it at 16.6%: $1,182,881,858 thousand (about $1.18 trillion) of e-commerce (Census Bureau, AIES 2024). They use different samples and definitions. Use the quarterly series for the trend and the annual survey for who does the selling.
Who makes the online sales?
Mostly companies that sell only at a distance. U.S. electronic shopping and mail-order houses reported $978,002,536 thousand (about $978 billion) of e-commerce sales in 2024 (Census Bureau, AIES 2024), about 82.7% of all retail e-commerce (our calculation), and e-commerce made up 80.7% of their own sales. Of that, $725,906,225 thousand came from companies whose main business is nonstore retailing. The rest came from online operations of companies whose main business is something else:
Main business of the company that owns the online seller
Electronic shopping and mail-order houses (NAICS 4541, 2017 basis), grouped by the owning company's primary business. Source: U.S. Census Bureau, Annual Integrated Economic Survey 2024. Census warns these estimates carry substantial sampling error, and it no longer publishes e-commerce sales by product category.
Store-based retail is a different picture. At U.S. food and beverage stores, e-commerce was only 3.5% of 2024 sales (Census Bureau). Manufacturers are far further online, with e-commerce at 66.6% of the value of their 2024 shipments (Census Bureau), but that is businesses ordering from each other, not shoppers.
How many video editors work for retailers?
Very few are on retail payrolls. The Bureau of Labor Statistics estimated 240 film and video editors and 230 camera operators among 15,503,410 wage and salary jobs in U.S. retail trade in May 2025 (BLS Occupational Employment and Wage Statistics: editors, camera operators, all retail jobs). That is about 1.5 editors per 100,000 retail jobs, and 0.9% of the 25,610 film and video editors on U.S. payrolls (our calculation; BLS, all industries). Across all industries BLS counts 21,550 camera operators (BLS).
Retailers employ many more of the people who commission video than the people who make it: 10,230 marketing managers, 46,460 market research analysts and marketing specialists, and 8,360 graphic designers (BLS: marketing managers, marketing specialists, graphic designers). Retail employs about 4.2% of the country's 197,830 salaried graphic designers, against 395,240 marketing managers and 899,580 marketing specialists nationally (BLS: designers, managers, specialists). The estimates leave out the self-employed, which is where much freelance video editing sits, and since the 2022 industry codes BLS has no separate e-commerce retail industry to report.
How much retail is sold online in other countries?
Of the countries in the table below, Great Britain reports the highest share: internet sales were 28.8% of the value of all retail sales in August 2026, seasonally adjusted, and online sales values were 8.9% higher than a year earlier (Office for National Statistics, Retail sales, Great Britain). No two statistics offices measure this the same way, so the table gives what each one counts.
The British share was 27.5% for 2025 as a whole, up from 19.2% in 2019, a rise of 8.3 percentage points (our calculation). It peaked at 37.8% in the January 2021 lockdown (ONS: annual series). Food is still mostly bought in person: at predominantly food stores the internet share was 9.5% in 2025 (ONS). In Australia the share went from 6.3% in 2019 to 11.4% in 2024 (ABS). Canadian retail e-commerce came to $5.5 billion (Canadian dollars) in July 2026 (Statistics Canada).
China sold 13,092.3 billion yuan of physical goods online in 2025 and 9,506.0 billion yuan from January to September 2026, up 3.8% (NBS: 2025, January to September 2026). The NBS stopped printing the national online share in 2026; its statistician puts the online share for large retailers alone at 31.8% for January to September 2026 (NBS). Japan's business-to-consumer e-commerce market, goods and services, was 26.1 trillion yen in 2024 (METI). South Korea's online shopping transactions were 24.2118 trillion won in August 2026, services included, and 78.1% of that value went through phones (Korea's national statistics office).
In the European Union, 78% of internet users aged 16 to 74 bought or ordered something online in 2025 (Eurostat). Measured from the seller side, EU enterprises with 10 or more employees made 19.49% of their 2024 turnover from e-commerce, mostly between businesses: web sales to consumers were 4.04% of turnover, and sales through online marketplaces 1.30% (Eurostat: e-commerce sales, web sales). In the UK, Amazon reached 88% of online adults in May 2025, and online adults spent an average of 51 minutes a day on YouTube, more than on any other social or video platform (Ofcom, Online Nation, via Internet Archive).
What do the biggest online sellers report, and what do they spend on advertising?
Amazon reported $716,924 million in net sales for 2025, of which $269,287 million came from its own online stores and $172,162 million from services it sells to marketplace sellers (Amazon.com, Inc., 2025 Form 10-K). Its advertising business brought in $68,635 million, up from $56,214 million in 2024: growth of 22.1%, and 9.6% of net sales (our calculation). The filing says advertising includes sponsored ads, display and video advertising, but it does not split out video. Amazon spent $23.5 billion advertising its own products and services, about 3.3% of net sales.
Shopify's merchants sold $378.4 billion of goods through its platform in 2025 (Shopify Inc., 2025 annual report on Form 10-K). Shopify's revenue was $11,556 million, its sales and marketing expenses $1,663 million, and the advertising inside that $753 million, about 6.5% of revenue (our calculation). The word "video" does not appear in the filing.
The other large sellers report advertising on different bases, so the table keeps each company's own definition:
Company
Online sales measure
Advertising or marketing
Share of sales
Etsy (fiscal 2025)
Gross merchandise sales $11,916.9 million
Marketing $914,830 thousand, 31.7% of revenue
24% of sales credited to its paid marketing
eBay (2025)
Gross merchandise volume $79,609 million; revenue $11,100 million
Sales and marketing $2,394 million, 22% of revenue; advertising revenue earned from sellers $1,993 million
Advertising revenue 2.5% of GMV (our calculation)
Wayfair (2025)
Online only
Advertising $1,425 million; U.S. $1,254 million
11.4% of net revenue
Chewy (fiscal 2025)
Online only
Advertising and marketing $824.9 million, including marketing payroll
6.5% of net sales
Walmart (fiscal 2026)
eCommerce: U.S. $99.6 billion, International $35.8 billion, Sam's Club $15.0 billion; total $150.4 billion
Advertising costs $5.4 billion
0.76% (our calculation) of net sales of $706,413 million
Target (fiscal 2025)
Digitally originated 20.6% of merchandise sales of $102,717 million
Advertising costs, net of vendor money, $1.5 billion; Roundel ad revenue $915 million
1.5% of merchandise sales (our calculation)
Best Buy (fiscal 2026)
Domestic online revenue $13,166 million, 34.4% of domestic revenue
Advertising $861 million
2.1% (our calculation) of revenue of $41,691 million
PDD Holdings, owner of Temu (2025)
Online marketing services sold to merchants RMB217,783.0 million
Sales and marketing RMB125,287.9 million
29.0% of revenue
MercadoLibre (2025)
Latin American marketplace
Advertising costs $1,690 million
Not calculated
Sources: Form 10-K or 20-F filings for fiscal 2025 or fiscal 2026 on SEC EDGAR: Etsy, eBay, Wayfair, Chewy, Walmart, Target, Best Buy, PDD Holdings, MercadoLibre. Shares marked "our calculation" are ours; the others are printed by the company. Walmart's eCommerce figures include store-fulfilled online orders and some advertising revenue, and Walmart U.S. eCommerce was 20.6% of its segment's sales of $482,975 million; across the company, eCommerce was 21.3% (our calculation).
None of these filings puts a number on video. We searched every 10-K, 20-F and 40-F filed on EDGAR from January 2024 to October 2026 for phrases such as "product video", "shoppable video", "live shopping" and "livestream commerce". Amazon names video advertising without a figure, eBay names eBay Live as a strategy and a risk without a figure, and Sea, JD and Alibaba describe live-stream and short-video tools without numbers. The one filer that quantifies a video selling channel is QVC, covered below.
What do the marketplaces allow for product video?
The limits range from a 15-second clip with no sound on Etsy to a 12-minute file on Amazon. We read each platform's own help or specification page on October 21, 2026; these pages change without notice.
Video ads inside the marketplaces have their own rules. Amazon's Sponsored Brands video ads run 45 seconds at most, with 20 seconds or less recommended, in files up to 500 MB (Amazon Ads specification). Amazon's two pages disagree on shape: the specification page lists 16:9 only, while its guide says vertical 9:16 is supported too (Amazon Ads guide). Sponsored Products video takes 1-5 videos per product, each at least 7 seconds, with no audio (Amazon Ads; specification). Walmart's Sponsored Videos run five to 45 seconds and are open only to brand owners and their authorised representatives (Walmart Connect).
Who may upload also varies. On Amazon, any seller with a professional account and at least three months of selling history can add listing video; brand registration is not required (Amazon). Google's product video field is new: Google announced it in April 2026 and did not start serving it until June 30, 2026 (Google). Etsy, which launched listing video in 2020, reported about 3.2 million seller videos uploaded that year and about 13 million by the end of 2021 (Etsy, Inc., 2021 Form 10-K).
What do the platforms say product video does to sales?
The only large-sample evidence comes from the platforms that sell the video tools and ad placements, and none publishes a method. Amazon says product pages saw an average 24% increase in sales after their first shoppable video was added, compared with pages without video, from its internal data for January to June 2026 (Amazon, Sell on Amazon). By category it reports 32.7% for toys, 30.5% for apparel, 26.7% for home and 25.8% for beauty (Amazon). It also says videos "can reduce returns by 40%", citing internal data from 2022 with no definition of what was compared (Amazon).
For video ads, Amazon Ads says Sponsored Products campaigns with video had a 9% higher conversion rate than campaigns without in June 2026, and a 67% higher click-through rate (Amazon Ads). Walmart Connect says 91% of the sales it attributed to Sponsored Videos for small and mid-sized advertisers came from customers new to the brand, February 2024 to January 2025 (Walmart Connect).
Read these as what they are. Sellers choose whether to add video, and the ones who do may also have better listings, bigger catalogs or more ad budget, so a gap between pages with and without video is not the effect of the video. No platform publishes a controlled test, a sample size or a confidence interval. Independent observation is thinner and more modest: in Baymard Institute's moderated usability testing, 41% of test users watched the product videos on the pages they visited (Baymard Institute, a 2019 finding), and its benchmark finds 67% of sites show no photos or videos from past buyers on product pages (Baymard Institute). Baymard sells UX research and does not publish the number of participants or sites behind either figure.
How big are social and live shopping, by the platforms' own numbers?
Only one live-shopping company publishes a dollar total. Whatnot says its sellers made $8 billion in live sales in 2025, more than double 2024 (Whatnot). Even if all of it were American, that would be 0.65% of U.S. retail e-commerce (our calculation; Whatnot's total covers several countries). Whatnot estimates the live-shopping market across North America and Europe at $22 billion and claims nearly 60% of it, from third-party data panels it does not publish (Whatnot, 2026 State of Live Selling Report). It said in August 2026 that sellers had already sold more than they did in all of 2025 in the first half of the year, that more than 650,000 people were joining each week, and in June that its sellers had passed one billion orders since 2019 (Whatnot: Series G, growth, orders). In a survey it commissioned, nearly nine in ten live sellers said live selling drives stronger sales than ordinary e-commerce (Whatnot). Whatnot is private and earns commission on these sales; none of its figures is audited.
TikTok gives dollar figures for single shopping weekends only. TikTok Shop launched fully in the U.S. on September 12, 2023, when TikTok said over 150 million people in the U.S. use TikTok (TikTok). TikTok says its sales passed $100 million on Black Friday 2024 alone, and passed $500 million over the four days from Black Friday to Cyber Monday 2025 (TikTok: 2024, 2025). The two are not the same span of days. Over its 2025 holiday campaign, TikTok says 50% more people bought on TikTok Shop than a year earlier, shoppers tuned into over 760,000 livestream sessions, sellers who went live grew sales 84%, and creators posted nearly 10 million shoppable videos (TikTok). Brands and creators hosted over 8 million hours of live shopping in the U.S. in 2024, 660K hours of it in the 2024 holiday campaign (TikTok: 2024 review, holiday 2024). TikTok's other figures are growth rates and counts with no dollar base: U.S. sales up 120% in 2025 to mid-June, over 70 million products on sale, more than 100 billion shopping searches in 2025, and live shopping sales that more than doubled in the first half of 2026 (TikTok: June 2025, 2025, 2026).
YouTube publishes no shopping sales figure. It says viewers watched over 30 billion hours of shopping-related video in 2023 and 35B hours in the twelve months to October 2025, a different window, so the two are only a rough series, and that there were more than 350M shopping-related videos on YouTube at the end of 2023 (YouTube: 2023, 2025). Its Shopping affiliate program grew from over 250,000 creators in September 2024, when it ran in two countries, to over 500,000 in January 2026 and over 1.3 million in September 2026, about 5.2 times in two years (our calculation; YouTube: 2024, January 2026, September 2026). By July 2025 it ran in the U.S. and 8 APAC countries (YouTube), and it lowered its entry bar along the way. YouTube says the merchandise sold through the program grew 13x over the two years to September 2026, without a dollar level (YouTube).
Meta reports what sellers spend on ads, not what they sell. Advantage+ shopping campaigns passed a $20 billion annual revenue run-rate in the fourth quarter of 2024, Reels passed a run-rate of $50 billion in the third quarter of 2025, video time on Instagram was up more than 30% on a year earlier, and partnership ads, which brands use to promote creators' posts about their products, reached a $10 billion run-rate in the first quarter of 2026 (Meta earnings calls: Q4 2024, Q3 2025, Q1 2026). The figure still quoted for Instagram shopping, 130 million people a month tapping product tags, dates from March 2019 (Instagram, via Internet Archive). Pinterest had 619 million monthly users and $4,221.8 million of revenue in 2025 (Pinterest, Inc., 2025 Form 10-K), and Snap says more than 250 million Snapchatters used its AR shopping lenses between January 2021 and April 2022 (Snap). eBay says GMV on eBay Live, its live-stream shopping service, grew roughly eight times year on year in the second quarter of 2026, again with no dollar level (eBay Inc.).
QVC is the oldest video shopping business with audited numbers. QVC reported $8,293 million of revenue in 2025, down from $8,997 million, with e-commerce 63% of it, and served about 10.3 million customers; its channels reach over 200 million households a day (QVC Group, Inc., 2025 Form 10-K). In the U.S., $3,969 million came through its websites, apps, social and streaming video, 66.9% of U.S. revenue, and about 90% of new U.S. customers made their first purchase there rather than through TV (QVC, Inc., 2025 Form 10-K).
China is the one country where a government has counted live-stream selling. The Ministry of Commerce put live-stream e-commerce sales at 1.98 trillion yuan in January to September 2023, 18.3% of online retail sales (Ministry of Commerce, via gov.cn), after more than 110 million live-stream sessions on monitored platforms in the first half of the year (Ministry of Commerce). Its later statements that we found give no national total. The China Internet Network Information Center counted 597 million e-commerce live-stream users at the end of 2023, the last time it printed that line, and 813.59 million live-stream users of any kind at the end of 2025, fewer than a year earlier, against 1.074 billion short-video users and 937 million online shoppers (CNNIC, via Internet Archive: 53rd report, 57th report). Among Chinese internet users aged 60 and over, 60.8% had watched an e-commerce live stream (CNNIC).
How do shoppers use video and reviews before they buy?
The independent U.S. evidence is about social media, not product pages. In Pew Research Center's 2022 survey, three in ten adult social media users said they had bought something after seeing an influencer or creator post about it, 39% said creators affect what they buy at least a little, and 3% said a lot (Pew Research Center). In 2024, 62% of U.S. adult TikTok users said product reviews and recommendations are a reason they use the app (Pew), and by 2025 37% of U.S. adults used TikTok (Pew). In 2022, 76% of U.S. adults said they ever shop online with a smartphone (Pew). Pew sells nothing to retailers and samples from a probability panel; every other survey in this section is run by a company that sells into the market.
Those company surveys report that shoppers want to see the product. In PowerReviews' December 2023 survey of 15,870 U.S. consumers, mostly women, 60% said they always look for photos or videos before buying, 91% said reviews with photos and videos make them more likely to buy, 70% called customer-made videos a necessary source of information, and 23% said they will not buy without a customer photo or video (PowerReviews). In Salsify's October 2025 survey of 2,712 shoppers in the U.S., Canada and the UK, 61% said they rely on high-quality images or videos to decide, while purchases driven by influencers fell 16% and livestream shopping 12% against its previous survey (Salsify). Wyzowl, which makes explainer videos, reports from 266 respondents in late 2025 (Wyzowl) that 85% said a video had convinced them to buy, 63% would most like to learn about a product from a short video, and 89% said video quality affects how much they trust a brand; it mixes marketers and consumers and does not say how many were consumers (Wyzowl, via Internet Archive). Wyzowl's answers swing widely between editions, as our short-form video statistics page shows.
Measured traffic shows how small social media still is at the till. Adobe, which tracks more than a trillion visits to U.S. retail sites through its analytics software, found social media drove 4.6% of online revenue in the 2025 holiday season, up from 3.3%, or about $11.9 billion (our calculation). The affiliate and partner channel, where Adobe files influencers, drove 20.4% (Adobe: 2025 holiday results). Adobe forecasts that influencers and creators will bring 22% of affiliate traffic in the 2026 season (Adobe forecast). Phones carried 56.4% of online transactions, and traffic from generative AI tools rose 693.4% from a small base (Adobe).
The two companies that measure holiday spending disagree by tens of billions of dollars, because they extrapolate from their own customers' sites:
Who measured
U.S. online holiday sales, Nov 1 to Dec 31, 2025
Basis
Adobe
$257.8 billion, up 6.8%
Adobe Analytics data from U.S. retail sites
Salesforce
$294 billion, up 4%
Activity on Salesforce's commerce platforms, extrapolated to the market
Gap
$36.2 billion
Our calculation
Sources: Adobe; Salesforce. For an official measure of a full quarter, use the Census Bureau's fourth-quarter e-commerce figure above.
Shoppers plan to spend 55% of their 2026 holiday budgets online, according to Deloitte's survey of 4,000 U.S. consumers in late August and early September 2026 (Deloitte). The Federal Reserve's payment diary shows how much of everyday spending happens away from a till: 37% of U.S. consumers' payments in October 2025 were made remotely (Federal Reserve Financial Services).
How often do shoppers abandon carts or send products back?
About seven in ten online carts are abandoned, by Baymard Institute's average of published studies. Baymard gives two slightly different averages on two of its own pages: 70.22% across 50 studies on its updated list, and 70.19% in its article on why people abandon (Baymard: abandonment statistics, reasons). The studies behind the average span many years and methods. In Baymard's 2026 survey of U.S. online shoppers, 42% of those who had abandoned a cart in the past three months were just browsing. Among the rest, 40% left because of extra costs such as shipping, tax or fees, 17% because checkout was too long or complicated, and 13% because of the returns policy. Baymard's benchmark finds the average U.S. checkout shows 23.48 form elements, against the 12 to 14 its testing suggests (Baymard Institute).
Online purchases come back more often than store purchases. The National Retail Federation and Happy Returns, a UPS company that sells returns services, projected $849.9 billion of U.S. retail returns in 2025, 15.8% of sales, and 19.3% of online sales: 3.5 percentage points more (our calculation; NRF). Retailers in the same survey said 9% of returns were fraudulent, and 71% of consumers who return online purchases said a poor returns experience makes them less likely to shop with that retailer again (NRF). Salesforce measured something different: by early January, 14% of global online purchases made in the 2025 holiday season had been returned (Salesforce). In Salsify's survey, 45% of shoppers said they had returned an online purchase because the product information was wrong or misleading (Salsify), the problem product video is meant to fix, though no source here measures whether it does.
What rules apply to product videos, reviews and testimonials?
In the U.S., the FTC's rule on consumer reviews and testimonials has been in force since October 21, 2024, and it covers video. It bans fake reviews and testimonials, including ones from people who do not exist, buying reviews conditioned on what they say, undisclosed insider reviews, company-run "independent" review sites and fake social media indicators (Federal Register). The FTC announced it on August 14, 2024, naming "AI-generated fake reviews" among its targets (FTC, via Internet Archive). A knowing violation can cost up to $53,088 per violation (eCFR, 16 CFR 1.98), an amount that stands for 2026 because the federal government cancelled that year's inflation adjustment on April 17, 2026 (Federal Register).
Enforcement under the rule has started. FTC staff sent warning letters to 10 companies in December 2025 (FTC). The FTC's case against supplement seller TruHeight ended in July 2026 with a $4 million judgment, suspended after a payment of $750,000 (FTC: complaint, order), and the Justice Department sued Premium Home Service under the rule on May 11, 2026 (FTC). Earlier cases used the FTC Act alone: Fashion Nova paid $4.2 million in 2022 for hiding reviews below four stars, and telemedicine firm NextMed agreed to pay $150,000 in 2025 over fake reviews and before-and-after photos (FTC: Fashion Nova, NextMed). In 2021 the FTC had put more than 700 companies on notice about deceptive endorsements (FTC).
Creator and influencer product videos also fall under the FTC's Endorsement Guides, revised on July 26, 2023: a paid relationship has to be disclosed clearly (Federal Register). One worked example in the Guides finds a disclosure made only with a platform's built-in tool, in small text and on screen for five seconds, "easy to miss and thus not clear and conspicuous" (eCFR, 16 CFR Part 255). Marketplaces have their own law. Since June 27, 2023 the INFORM Consumers Act has required them to verify and disclose information about high-volume sellers (FTC, via Internet Archive), defined as sellers with 200 or more sales and $5,000 or more in revenue in a 12-month period (15 U.S.C. 45f). Temu's operator paid $2 million in the first INFORM Act case, in September 2025 (FTC). And the FTC's mail-order rule still requires an online seller that names no shipping time to ship within 30 days (eCFR, 16 CFR Part 435).
Shopping fraud is a large part of what consumers report. People filed 3 million fraud reports with the FTC in 2025 and reported $15.9 billion in losses (FTC testimony). Scams that began on social media cost $2.1 billion, about 13.2% of the total (our calculation); shopping scams were the most reported type there, and more than 40% of people who lost money to a social media scam said it began with something they ordered from an ad (FTC Data Spotlight, via Internet Archive). In 2024 online shopping was the second most reported fraud category, after impostor scams (FTC, via Internet Archive).
European and British regulators have measured how often the rules are broken. In the EU's 2023 sweep of 576 influencers, 97% posted commercial content but only 20% consistently disclosed it as advertising, and 38% did not use the platforms' paid-partnership labels (European Commission: results, details). In its 2021 sweep of review sections, authorities could not confirm for 144 of 223 major websites that reviews were genuine, and in its 2025 Black Friday sweep of 314 traders at least 30% broke the rule that a discount must be measured against the lowest price of the previous 30 days (European Commission, sweeps). The UK government estimates that 11% to 15% of reviews in three common product categories on e-commerce platforms are probably fake (Department for Business and Trade), and the Competition and Markets Authority puts the UK spending potentially influenced by online reviews at £23 billion a year (CMA). The CMA opened 5 fake-review investigations in March 2026 (CMA). The Advertising Standards Authority estimates that about 57% of UK influencer ads on Instagram and TikTok were adequately labelled in 2024 (ASA).
What the popular ecommerce video statistics really say
Lists of "ecommerce video statistics" repeat a small set of lift figures, and most of them began as one company describing its own site, its own clients or a single test. We traced the most repeated to the earliest document we could read. Pages that repeat a claim are linked only as dated evidence of how it changed, never as a source for the number. Some of these figures have reached securities filings: Vimeo's annual report for 2024 repeats a HubSpot prediction that 80% of consumers will rely on product videos to make purchasing decisions (Vimeo, Inc., Form 10-K), and Cheer Holding's 2025 Form 20-F repeats that live commerce converts 8-10x better than ordinary e-commerce (Cheer Holding, Inc., Form 20-F). A number in a filing is still only as good as its origin.
"Zappos sells 6% to 30% more when a product has a video"
This was a remark at a trade show, not a study. In December 2009 Streaming Media's Dan Rayburn reported that a Zappos content manager told the November 2009 Streaming Media West conference that Zappos sells 6-30% more merchandise, depending on the item, when it has a product video (Streaming Media, via Internet Archive). No method, period or comparison was given, and the range spans different products. In April 2012 a Streaming Media feature turned it into a conversion rate: Zappos "has reported that its conversion rates range from 6 to 30 percent" (Streaming Media), several times any normal online conversion rate. Econsultancy's January 2013 roundup, the version most lists now cite, says sales rose by between 6% and 30% for items with product demos, without a link to Zappos (Econsultancy). The same month Zappos's photo and video manager told Computerworld that the company had uploaded more than 250,000 product videos since 2009 but "can't share the figures", saying only that products with videos "tend to sell better" (Computerworld). Zappos never published a number. Use instead, if anything, a platform that does publish one, with its limits: Amazon's own 24% average figure above.
"Shoppers who view video are 85% more likely to buy"
This began with one UK golf retailer. In October 2009 the site-search company SLI Systems blogged that Online Golf's Lee Brown had said on its podcast that people who watch a video on the retailer's site are 85% more likely to buy than people who don't (SLI Systems, via Internet Archive). That compares shoppers who chose to press play with those who didn't, so it measures interest as much as the video. In March 2010 Treepodia, the vendor that made Online Golf's videos, announced a tool with a control group and said visitors offered video converted at an average 85 percent higher rate, without saying how many sites or visitors that covered (Retail Customer Experience, reporting Treepodia). By January 2015 the product-video vendor Invodo listed "Visitors who view product videos are 85% more likely to buy" with the retailer's name gone, credited to Internet Retailer, 2010 (Invodo, via Internet Archive), and blogs still carry that form: "85% more likely to buy ... (Internet Retailer, April 2010)" (CMIT Solutions). We did not find an Internet Retailer article from April 2010 with the figure.
"People spend 2.6x more time on pages with video"
This is Wistia measuring its own website, and Wistia has since replaced it with a smaller number. In December 2016 Wistia, which sells video hosting, reported that across its 100 busiest pages from June 2013 to July 2016, visitors spent 7 minutes 21 seconds on pages with video against 2 minutes 48 seconds on pages without, 2.6x (Wistia, via Internet Archive). Wistia chose which of its pages got video, so the comparison is between different pages, and none of them was a shop. Its rerun at the same address, for January 2021 to April 2022, found 6 minutes against 4.3 minutes, about 1.4x (Wistia). Six weeks after the first post, the agency Insivia listed "2.6x more time on pages with video" with no credit to Wistia (Insivia, via Internet Archive), and a video-commerce vendor's blog still carries it as "2.6x", credited only "via Insivia" (Vyrill). If you cite Wistia, cite its current 1.4x and say it describes one company's own pages.
"Live commerce converts at nearly 30%, ten times ordinary e-commerce"
The sentence comes from McKinsey, and it has no source. McKinsey's July 2021 article on live commerce says "Companies report conversion rates approaching 30 percent—up to ten times higher than in conventional e-commerce", the only claim in that passage without a footnote (McKinsey & Company, via Internet Archive). The article's own conversion figures are narrower. A sidebar says sessions on the top livestream accounts on China's Taobao had a conversion rate of 28 percent in November 2020, about 75,000 orders from 266,000 viewers, in the month of the Singles' Day sales, and the German beauty retailer Douglas reported conversion rates of "up to 40 percent" for its shows, from a news report. Neither is an average for live commerce, and neither is measured the way a store's conversion rate is. Repeaters have made it a finding: "McKinsey reported that companies utilizing live shopping see a conversion rate of almost 30%" (Twilio), and a 2026 statistics page widens it to "between 9% and 30%" against a 2-3% product-page baseline McKinsey never gave (AutoFaceless). No platform publishes a live-shopping conversion rate.
"Live commerce will be 10% to 20% of all e-commerce by 2026"
McKinsey wrote this as a conditional ceiling, not a forecast. Its July 2021 article says that "If China's experience is any guide ... live-commerce-initiated sales could account for as much as 10 to 20 percent of all e-commerce by 2026", extrapolated from an estimated 10 percent share of Chinese e-commerce in 2020 that McKinsey calculated from iResearch figures (McKinsey & Company). It does not say which country's e-commerce. By December 2021 Tubefilter reported that McKinsey "estimated that shoppable livestreams will drive between 10 and 20% of all ecommerce revenue by 2026" (Tubefilter). Now that 2026 has arrived: in China the Ministry of Commerce counted live-stream sales at 18.3% of online retail in January to September 2023, inside McKinsey's range. In the U.S. no official figure exists, and the one platform that publishes a dollar total, Whatnot, equals at most 0.65% of U.S. e-commerce.
"Videos on Amazon listings increase sales by up to 9.7%"
Amazon did publish this, in a seller forum post, with almost no method. In March 2024 Amazon staff wrote that videos on detail pages "have been known to" increase sales by up to 9.7% (Amazon Seller Forums). The footnote is the whole method: the lift in third-party seller revenue over a 90-day period after a video was added to a listing that had none, 2022 U.S. data (Amazon Seller Forums Europe). It is a before-and-after comparison on listings whose sellers chose to add video, with no count of listings. The same posts give two different multiples for shoppers who watch: 3.6x more likely to convert than shoppers who don't, from 2018-2020 data, and four days later 5x, from January to July 2023 data. Both compare people who chose to watch with people who didn't. Amazon's UK seller site reports an average 21.8% sales increase from a separate 2024 study of 17 marketplaces outside the U.S. (Amazon Sell UK), and its current U.S. page gives the 24% shown above. Agencies have hardened the numbers: one says shoppers are "3.6x more likely to buy a product that has a video" and that videos "increase sales up to 9.7% on average across categories" (Acadia), turning a comparison of viewers into a comparison of pages and joining "up to" with "on average". Use Amazon's own figures with Amazon's wording, and say they are a platform describing its own data.
"96% of consumers find videos helpful when making purchase decisions online"
This is a 2014 opinion poll by a company that sells a video-making app. Animoto announced in March 2014 that 96% of consumers in its survey find videos helpful when making purchase decisions online (Animoto, via Internet Archive). The survey was an online poll of 1,014 U.S. adults fielded December 26 to 30, 2013 (MarketingProfs, reporting Animoto). "Helpful" is what respondents said, not what they bought, and the figure is now more than twelve years old.
"67% of TikTok users say TikTok inspired them to shop when they weren't planning to"
TikTok published this about Australian users, without a sample. The figure sits in a May 2022 post on TikTok's Australian newsroom, summarising an Australian e-book, and is not tied to a named study: 67% (TikTok Newsroom, Australia). Three months later TikTok's own marketer's guide to retail gave 71% for the same statement, again with no sample (TikTok, via Internet Archive). The nearest TikTok-published figure with a stated method is a 2021 study it co-funded with WARC and Publicis: of 2,230 people aged 18 to 45 in 11 markets, more than 70% agreed that social media platforms in general had inspired them to buy when they weren't looking to shop (TikTok Newsroom). Statistics pages now state the 67% as a fact about TikTok users everywhere (Capital One Shopping). For U.S. TikTok users, cite Pew instead: 62% say product reviews and recommendations are a reason they use it.
"Product videos reduce returns by 25%"
The best-known version is one jeweller's whole page redesign. In December 2009 Ice.com told Internet Retailer that more detailed product pages, with videos replacing static images alongside larger photos, recommendations and ratings, had cut its monthly return rate from 12% to under 9% (Internet Retailer, via Internet Archive), a relative fall of at least 25% (our calculation). Invodo, which sold product video, later wrote that "Ice.com also credits video with decreasing returns by 25%" (Invodo, via Internet Archive), giving video credit for the whole redesign. A separate 25% comes from a 2016 press release by the Berlin product-video platform DemoUp, with no definition of how returns were measured (DemoUp press release). Shopify app vendors now give it as a general average, "reduce return rates by 25% on average" (EasyApps Ecommerce). Amazon's own 40% returns claim, from 2022 internal data, has no published method either. For returns themselves, use the NRF's estimate that 19.3% of 2025 U.S. online sales came back.
"Online shoppers who view demo videos are 1.81x more likely to purchase"
We found no original for this one. The oldest copy we could find is in the agency Insivia's January 2017 list of video statistics, which names no source for it, and older Insivia lists captured by the Internet Archive do not carry it. Searches for its other wordings ("1.81 times", "81% more likely"), Invodo's statistics page and benchmark reports, Adobe's retail video coverage and Animoto's surveys found nothing earlier. A 2026 store-builder's playbook now credits the 1.81x figure to Animoto and dates the EyeView 80% to 2024 (LaunchMyStore). Treat it as unsourced.
Three claims traced on our other pages
"Video on a landing page increases conversions by 80%" comes from a 2010 white paper by EyeView Digital, which sold landing-page video, where 80% is a best case "in some cases"; its one fully described test, on a forex trading site rather than a shop, raised conversion by almost 32 percent (EyeView Digital, via Internet Archive; full trace on our video advertising statistics page). "64% of users are more likely to buy after watching a video" is comScore's 2010 comparison of retail site visitors who watched video with those who didn't, 64% more likely to buy, at a time when 96% of U.S. online spenders watched online video at all, so the non-watchers were an unusual group (comScore, via Internet Archive; full trace). "144% more likely to add to cart" is one housewares retailer, Stacks and Stacks, describing its own tests to Internet Retailer in 2011: up to 144% (Internet Retailer; full trace on our motion graphics statistics page).
We started from the questions people search for about ecommerce video statistics and looked for the organization that actually produced each answer. Every figure on this page sits in an evidence ledger with its source, the exact table or paragraph it came from, the measurement period, the population measured, and the date we checked it. This edition holds 337 figures from 77 publishers.
On October 21, 2026, each of the 313 sourced figures on this page was re-fetched with the fetch cache cleared and matched against the recorded wording: 297 from the publisher's page, file or filing, and the 11 BLS occupational estimates through the BLS public data API. Five figures from pages that refused the script that day or build their text with JavaScript (Shopify's Help Center, Amazon Seller Central and TikTok Shop's Partner Center) were matched on the live page in a headless browser the same day. Pages that block automated requests or have moved, including ftc.gov, Etsy's Help Center, Walmart Marketplace Learn, Statistics Canada, the Australian Bureau of Statistics, Ofcom, McKinsey and CNNIC's report files, were checked against dated Internet Archive copies, 57 figures in all. We left out what we could not re-check or use: the full NRF and Salsify reports, which sit behind registration forms; TikTok Seller University, which needs a login; FTC fraud counts by category, published only in a data file; e-commerce sales by product category, which the Census Bureau no longer publishes; METI's smartphone share, which METI says partly rests on a market-research estimate; and Chinese live-commerce totals widely reported in the press that we could not find in an official release.
We only cite the producer: government agencies, regulators, company filings and official posts, and the survey owner's own report. We do not cite statistics roundups, Statista-style aggregators, or salary sites without a public method. We did not bypass paywalls or sign-up forms; where a full report was gated, we used only the figures its publisher states publicly.
Figures marked "our calculation" are arithmetic on the cited numbers, and anyone can reproduce them:
This edition contains no Mark Studios customer data.
Limitations
No independent source measures what product video does to sales. The sales and returns figures for video come from Amazon and Walmart describing their own internal data, with no published sample, control group or confidence interval. Sellers who add video may differ from sellers who don't.
Most shopper surveys come from companies that sell into the market. PowerReviews, Salsify, Wyzowl, Baymard Institute, Adobe, Salesforce, Deloitte, Whatnot and the NRF's partner Happy Returns all sell to retailers or sellers. Pew Research Center and the government sources do not.
Platform figures are self-reported and mostly growth rates. TikTok, YouTube and eBay publish growth multiples and counts for their shopping features, rarely dollar totals, so their size cannot be checked against the Census denominator. Run-rates such as Meta's are a quarter's revenue multiplied by four.
Countries measure online sales differently. The comparison table gives each office's own definition (value or volume, goods only or goods and services, with or without fuel and car dealers). Compare orders of magnitude, not small gaps.
Census figures are revised. The quarterly e-commerce series is restated with each annual benchmark, so a figure here can differ from the same quarter in an older release.
Specifications change without notice. The product video limits were read from each platform's help or specification pages on October 21, 2026. Two platforms contradict themselves on their own pages; the table shows both.
Rules are described as they stood on October 21, 2026. This page is not legal advice.
How to cite this page
For a single figure, cite the original publisher named next to it, and link here if the verification trail is useful to your readers. Each figure has its own anchor, so you can link straight to it, for example https://www.markstudios.com/research/ecommerce-video-statistics#CEN-002. To cite the page as a whole:
Mark Studios. "Ecommerce Video Statistics." Last verified Oct 21, 2026. https://www.markstudios.com/research/ecommerce-video-statistics
Our calculations and the evidence table are free to reuse with attribution and a link to this page. Each underlying figure remains the claim of its original publisher, and some publishers ask for a link when their figures are reused.
We re-verify every figure quarterly and when a major source publishes a new edition. The next scheduled review is January 2027. Corrections go to contact@markstudios.com.
Oct 21, 2026: First published with 337 figures from 77 publishers, each checked against its original source.
Frequently asked questions
What percentage of U.S. retail sales are online?
17.1% in the second quarter of 2026, seasonally adjusted, according to the U.S. Census Bureau: $340.2 billion of $1,986.5 billion. For 2025 as a whole the share was 16.4%, or $1,233.7 billion. The share peaks in the holiday quarter: 18.3% in the fourth quarter of 2025 before seasonal adjustment.
How long can a product video be on Amazon, Shopify and Etsy?
Amazon accepts listing videos of 1 to 12 minutes and up to 5 GB. Shopify accepts product videos up to 10 minutes and 1 GB. Etsy allows one listing video of 3-15 seconds, up to 100 MB, which plays without sound. Google Merchant Center takes product videos of 6 to 240 seconds. These limits were read from each platform's own pages on October 21, 2026.
Do product videos increase ecommerce sales?
The only large-sample figures come from the platforms. Amazon says product pages saw an average 24% sales increase after their first shoppable video, from internal data for January to June 2026, and Amazon Ads reports a 9% higher conversion rate for Sponsored Products campaigns with video. Neither publishes a method or a control group, and sellers who add video may differ from those who don't. In Baymard Institute's usability testing, 41% of test users watched product videos.
How big is live shopping in the U.S.?
No government source measures it. Whatnot, the only platform that publishes a dollar figure, says its sellers made $8 billion in live sales in 2025 across its markets, which would be at most 0.65% of U.S. e-commerce. TikTok, YouTube and eBay publish growth rates rather than totals. In China, the Ministry of Commerce counted 1.98 trillion yuan of live-stream sales in January to September 2023, 18.3% of online retail.
Are fake video testimonials illegal?
In the U.S., yes. The FTC's rule on consumer reviews and testimonials, in force since October 21, 2024, bans fake reviews and testimonials, including ones from people who do not exist, with civil penalties of up to $53,088 per violation. Paid creators also have to disclose the relationship under the FTC's Endorsement Guides. The UK has banned fake reviews since 6 April 2025, with fines of up to 10% of global turnover. This is not legal advice.
What percentage of online purchases are returned?
The National Retail Federation and Happy Returns estimated that 19.3% of U.S. online sales were returned in 2025, against 15.8% of all retail sales, and projected $849.9 billion of total returns. Salesforce, measuring its own platforms worldwide, found 14% of 2025 holiday online purchases had been returned by early January.
How often is this page updated?
Every figure is re-checked against its original source each quarter, and sooner when a major source publishes a new edition, such as the Census Bureau's quarterly e-commerce release or a company's annual report. The Last verified date changes only after that check, and each change is recorded in the change log.