Every figure on this page links to the organization that produced it, and each was re-checked against that source before publishing. How many car dealers there are and who works for them, what dealers and the public car retailers spend on advertising, how big the listing marketplaces are, how car shoppers research and where video fits, what YouTube, TikTok and the other platforms report, the rules on car ads, and which popular automotive video statistics don't hold up.
The U.S. had 16,990 franchised new-car dealerships at the end of 2025. The Census Bureau counts 21,910 new car dealer locations with paid staff, and 126,322 used car dealers with no employees at all. (NADA; U.S. Census Bureau)See details
Franchised dealers spent $9.96 billion on advertising in 2025, $739 for every new vehicle sold, up 8.0% in total from 2024. (NADA; our calculation)See details
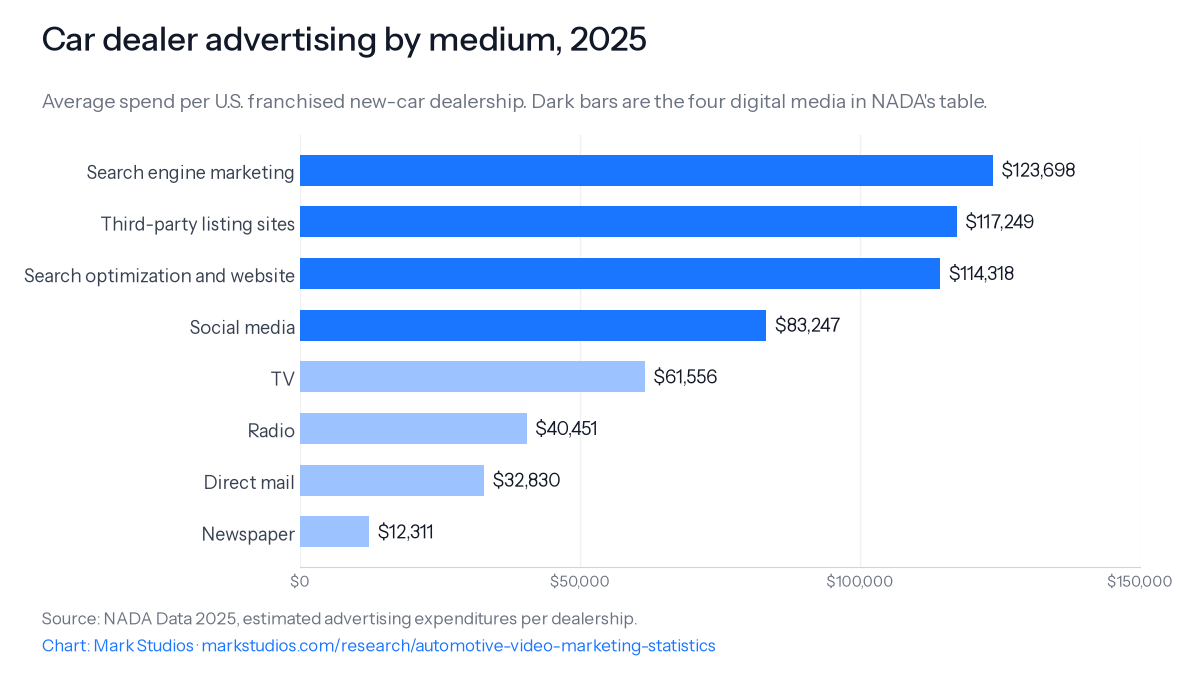
Search ads, listing sites, websites and social media took 74.8% of the average dealership's ad budget in 2025. Social media alone was 14.2%, more than TV at 10.5%. NADA has no line for video. (NADA; our calculation)See details
Public car retailers spent from about $206 to $608 on advertising per vehicle retailed in 2025, by our calculation from their annual reports. CarMax puts its own figure at about $200 per unit sold. (Company 10-K filings; our calculation)See details
Of 1,290,550 jobs at U.S. car dealers in May 2025, 950 were marketing managers, 3,260 marketing specialists and 30 camera operators. BLS publishes no estimate for video editors at dealers. (U.S. Bureau of Labor Statistics)See details
75% of car buyers used third-party websites while shopping in 2025, but 53% completed every purchase step at the dealership and 7% bought entirely online. (Cox Automotive)See details
18.3% of new-vehicle buyers cited YouTube as a shopping source in 2024, against 2.2% for TikTok. (Strategic Vision)See details
The FTC warned 97 dealer groups in March 2026 that advertised prices must include all mandatory fees, and in October 2026 alleged that one group charged buyers more than $3,350 over the advertised price on average. (Federal Trade Commission)See details
How many car dealers are there in the U.S.?
The U.S. had 16,990 franchised new-car dealerships at the end of 2025, by the count of the dealers' own trade association (National Automobile Dealers Association, NADA Data 2025), and 16,991 at mid-year 2026 (NADA Data 2026 midyear report). The Census Bureau, which counts physical locations with paid staff rather than franchises, found 21,910 new car dealer establishments in 2023, employing 1,131,340 people in mid-March (U.S. Census Bureau, County Business Patterns), about 51.6 employees per location (our calculation). The two counts measure different things, so neither is wrong.
Used-car selling is a different business: mostly small and often one person. The Census Bureau counted 25,147 used car dealer establishments with paid employees in 2023, employing 162,048 people, and 126,322 used car dealers with no employees at all in 2024 (County Business Patterns; Nonemployer Statistics). That is about 5 one-person used car dealers for every used car lot with a payroll (our calculation; the two series cover different years and slightly different units). The dealers with no employees took in $21,199,229 thousand (about $21.2 billion) in 2024 (Nonemployer Statistics).
Franchised dealerships are consolidating slowly. The 2022 Economic Census found 17,242 firms operating 22,483 new car dealer establishments (U.S. Census Bureau, Economic Census 2022), and NADA reports that 90.5% of franchised dealership owners ran one to five stores in 2025, down from 94.4% in 2016 (NADA Data 2025).
U.S. new car dealers with paid employees sold $1,197,374,647 thousand (about $1.20 trillion) of goods and services in 2024, and used car dealers $157,724,139 thousand (about $157.7 billion) (U.S. Census Bureau, Annual Integrated Economic Survey: new car dealers, used car dealers). All motor vehicle and parts dealers together sold $1,580,065,533 thousand, 22.2% of the $7,106,698,148 thousand in sales by all U.S. retail employer firms (Census, AIES 2024: motor vehicle and parts dealers, all retail; our calculation). The same survey asks about e-commerce sales and purchased advertising, but the Census Bureau withholds both for every dealer category, so there is no government figure for how much car dealers sell online or spend on ads.
NADA counts 16.2 million new light-duty vehicles sold by franchised dealers in 2025 and total dealership sales of more than $1.3 trillion (NADA Data 2025). The average new vehicle sold for $48,205 at retail (NADA Data 2025). Measured from the buyer's side, Americans spent $412,659 million on new motor vehicles in 2025 and $222,315 million on net purchases of used motor vehicles, a national-accounts measure that nets out sales between households and is not the value of used cars sold at retail (U.S. Bureau of Economic Analysis, NIPA annual data). The fleet those buyers drive held 297,525,836 registered motor vehicles in 2024 (Federal Highway Administration, Highway Statistics, table MV-1).
Who works at car dealerships, and how many work in marketing or video?
U.S. automobile dealers employed 1,290,550 wage and salary workers in May 2025, at a median annual wage of $47,370 (U.S. Bureau of Labor Statistics, Occupational Employment and Wage Statistics). Almost none of them make marketing or video. BLS estimates 950 marketing managers and 3,260 market research analysts and marketing specialists at dealers, roughly one for every 11 dealer locations (our calculation, approximate because it mixes the 2023 location count with 2025 job estimates). It counts 1,040 photographers and 30 television, video and film camera operators, together 0.08% of dealer jobs (our calculation), and publishes no estimate at all for film and video editors at dealers. The camera-operator estimate carries a 21.6% relative standard error, so treat it as an order of magnitude.
Selling is the bigger job. Retail salespersons held 17.5% of dealer jobs (our calculation). BLS projects dealer employment to grow 2.2 percent from 2025 to 2035 and the number of dealer sales managers to fall 7.5 percent (BLS Employment Projections, National Employment Matrix). The monthly payroll survey put dealer employment at 1,289.1 thousand in July 2026 (BLS Current Employment Statistics), close to the occupational survey's total.
How much do car dealers spend on advertising?
U.S. franchised dealerships spent $9.96 billion on advertising in 2025, the most in NADA's published series since 2016, and $739 for every new vehicle they sold (NADA Data 2025). The total rose 8.0% from $9.22 billion in 2024, and spending per new vehicle rose 4.8% from $705 (NADA Data 2025's year-by-year chart; our calculation). The previous high was $9.82 billion in 2016 (NADA Data 2023). Advertising per new vehicle equals about 1.5% of the average new-vehicle retail price (our calculation).
The average franchised dealership spent $586,246 on advertising in 2025 (NADA Data 2025), up 10.8% from $528,923 in 2023 (NADA Data 2023; our calculation). Spending is still climbing: dealers spent $5.04 billion in the first half of 2026, $791 per new vehicle sold (NADA Data 2026 midyear report). In Cox Automotive's dealer survey for the third quarter of 2026, franchised dealers in the Northeast scored 61 on its marketing-spend index (55 in the Midwest, 58 in the South, 50 in the West), where a score above 50 means more dealers raised marketing spend than cut it (Cox Automotive Dealer Sentiment Index, Q3 2026; 929 dealers, fielded July 22 to August 5, 2026).
Three quarters of dealer advertising goes to digital media. Search ads, third-party listing sites, search optimization and websites, and social media made up 74.8% of the average dealership's spending in 2025 (our calculation from NADA's table below). Social media's share rose to 14.2% from 12.1% in 2023, while TV held at 10.5%, against 10.0% in 2023. NADA reports no separate line for online video, connected TV or YouTube, so no dealer-wide figure exists for spending on video.
Car dealer advertising by medium, 2025Average spend per U.S. franchised new-car dealership. Dark bars are the four digital media in NADA's table. NADA reports no separate line for video.
What do the public car retailers spend on advertising per car sold?
Publicly listed U.S. car retailers spent roughly $200 to $600 on advertising for each vehicle they retailed in 2025, by our calculation from their annual reports: from about $206 at Group 1 Automotive to $608 at Carvana. CarMax puts its own figure at about $200 per unit sold, counting wholesale units (CarMax 10-K, fiscal 2026). The table divides each company's advertising expense by the vehicles it retailed.
Retailer
Advertising expense
Vehicles retailed
Advertising per vehicle (our calculation)
Carvana (2025)
$363 million
596,641 used
$608
AutoNation (2025)
$267.9 million
528,822 new and used
$507
Sonic Automotive, EchoPark used-car stores (2025)
$30.2 million
67,636 used
$447
CarMax (fiscal 2026)
$284.3 million
780,684 used
$364
Sonic Automotive, franchised dealerships (2025)
$69.9 million
220,183 new and used
$317
Lithia & Driveway (2025)
$257.0 million
402,575 new + 425,381 used
$310
Penske Automotive Group, retail automotive (2025)
$127.7 million
259,502 new + 226,301 used
$263
Asbury Automotive Group (2025)
$68.9 million
181,204 new + 143,126 used
$212
Group 1 Automotive (2025)
$94.5 million
224,166 new + 234,906 used
$206
Sources: each company's annual report on Form 10-K (Carvana, AutoNation, Sonic Automotive, CarMax, Lithia & Driveway, Penske, Asbury, Group 1). Companies define advertising differently. AutoNation, Lithia and Asbury report it net of manufacturer advertising support; Group 1 does not say. Lithia, Penske and Group 1 include stores outside the U.S. Because franchised groups can offset advertising with manufacturer support, compare the franchised and used-only rows with care.
At Sonic Automotive, the used-only stores pay more to bring in each buyer. Sonic Automotive's EchoPark used-car stores spent 12.9% of their gross profit on advertising in 2025, against 3.3% at its franchised dealerships (Sonic Automotive 10-K). Carvana spent $490 million on advertising in 2022 while retailing 412,296 vehicles, about $1,188 each, then cut spending to $229 million in 2024 (416,348 vehicles, $550 each) before raising it again in 2025 (Carvana 10-K for 2023; Carvana 10-K for 2024; our calculation).
Where the companies say how the money is spent, it is mostly digital. Lithia & Driveway says over 88% of its 2025 advertising went to digital, social, listings and one-to-one owner communications, and that it cut its marketing cost per retail delivery by 21% (Lithia Motors 10-K). CarMax says 81% of its retail sales in fiscal 2026 were digitally enabled, 13% of them completed fully online (CarMax 10-K). None of these filings puts a number on video: a full-text search of 10-K filings from 2024 to October 2026 for "walkaround video", "video walkaround", "walk-around video" and "vehicle videos" returned no results.
How big are the car listing marketplaces, and what do they say about video?
CarGurus averaged 32,480 thousand (about 32.5 million) U.S. monthly unique users in the fourth quarter of 2025 (CarGurus 10-K), and Cars.com averaged 25,708 thousand (about 25.7 million) monthly unique visitors across 2025 (Cars.com 10-K). The two companies measure visitors with different tools, so the gap between them is approximate. TrueCar, which stopped filing with the SEC in 2026, averaged 6,992,640 monthly unique visitors in 2024 (TrueCar 10-K for 2024).
The marketplaces are advertisers too. CarGurus spent $183.0 million on advertising in 2025, Cars.com $109.1 million, and TrueCar $31.2 million on marketing and advertising in 2024 (CarGurus, Cars.com and TrueCar annual reports). Cars.com earned an average of $2,460 a month from each dealer customer in 2025 and said about 60% of its 2024 traffic arrived organically (Cars.com 10-K for 2025; 10-K for 2024).
Video appears in the filings as a product, not a metric. Cars Commerce sells dealers and automakers an In-Market Video product that places their video ads in front of car shoppers on social media, streaming apps and connected TV (Cars.com 10-K). Carvana describes an automated photo system that builds a 360-degree virtual tour of each actual car, with imperfections shown in high-definition photos (Carvana 10-K). Neither company reports how many listings carry video or what it does to sales.
The UK's largest car marketplace publishes how its audience arrives. In the year to March 2026, only 4% of visits to Autotrader came from paid web traffic, and less than 1% of its audience came from AI chat assistants (Autotrader Group plc, full year results 2026). An average of 13,942 retailer forecourts advertised on it each month, uploading more than 340,000 vehicles a month, and its audience spent 548 million minutes a month on the site and apps. Autotrader cut its own marketing spending to £21.9 million (Autotrader Group plc).
How do car shoppers research, and where does video fit?
Most car buyers research online and then buy in person. In Cox Automotive's 2025 Car Buyer Journey study, 75% of U.S. buyers used third-party websites while shopping, 59% used dealership websites and 26% used social media; they visited 4.6 websites on average and spent 7 hours 11 minutes researching and shopping online (Cox Automotive; 2,344 buyers from the past 12 months who used the internet while shopping, fielded August 6 to September 5, 2025). Yet 53% completed every purchase step at the dealership and 7% bought completely online, while 28% said they would like to buy entirely online. 19% used AI websites or AI search summaries. Cox Automotive owns Autotrader and Kelley Blue Book and sells marketing to dealers.
The whole process is getting shorter. Cox's 2024 study timed it at 14 hours 19 minutes, and Cox puts the long-run change at 18 hours in 2010 to 14 hours in 2024; the same study found 65% of buyers contacted the dealership before visiting, up from 20% in 2009 (Cox Automotive Car Buyer Journey 2024; Cox Automotive). In CarGurus' 2025 survey of 3,030 recent buyers and sellers, buyers visited 2.1 dealerships on average, only 56% bought after a single visit, 69% test drove only in person and more than 80% finished within a month (CarGurus Consumer Insights Report 2025, with NielsenIQ, May and June 2025). Capital One's 2025 survey found 46% of recent buyers researched online before visiting a dealer, 60% started with sources unrelated to the dealer, and 74% used a mix of online and in-person buying (Capital One Car Buying Outlook, fielded August 12 to 24, 2025). In Deloitte's 2026 study, 47% of U.S. consumers said they rely on dealer interactions to research their next vehicle and 40% named experiencing the vehicle in person as one of the most important parts of the purchase (Deloitte Global Automotive Consumer Study).
Video reaches a minority of buyers as a named source, and YouTube most of all. In Strategic Vision's 2024 study of more than 57,000 new-vehicle buyers, 18.3% cited YouTube as a source, against 2.2% for TikTok, though 13% of Gen Z buyers cited TikTok (Strategic Vision, New Vehicle Experience Study; field dates not published). In J.D. Power's 2016 shopper study, 13% of new-vehicle internet shoppers used YouTube, the most-used social site, and 22% used any social media site (J.D. Power New Autoshopper Study, via Internet Archive). Video also matters after the sale: in J.D. Power's 2025 sales satisfaction study of 32,616 new-vehicle buyers, 22% wanted a follow-up explanation of their car's features a few weeks after delivery, by phone, a dealership visit or online video, and 53% of those never got one (J.D. Power 2025 U.S. Sales Satisfaction Index, via Internet Archive).
Sources: Strategic Vision; J.D. Power; Cox Automotive; J.D. Power. The surveys ask different people different questions, years apart; the spread is the point. "Cited as a source" and "used while shopping" are not the same as "influenced the purchase".
For video in general, not cars, Pew Research Center found in 2018 that 54% of U.S. adult YouTube users said the site is important for helping them make purchase decisions, and 51% said it is very important for figuring out how to do things they have not done before (Pew Research Center).
What do YouTube, TikTok and the other platforms say about car video?
Google has published the most data on car video, most of it between 2011 and 2020. In February 2016 it reported that one in three U.S. adults aged 18 to 54 who go online watched car content on YouTube once a month (Think with Google, Google/Ipsos Connect, 2,503 adults). In 2015, auto review videos on YouTube were watched for more than 3 million hours in the U.S. between January and September, and watch time of test-drive, feature and walk-through videos was up nearly 2X on the same months of 2014 (Think with Google). Google's own dealer guide claims there are two times as many test-drive videos on YouTube as test drives on dealer lots, a modelled comparison from sales data, a survey and YouTube's internal counts that shows no calculation (Google Dealer Guidebook).
Most car video is not made by car brands. Branded auto videos grew from a 4% monthly share of auto video views on YouTube to 7% between December 2017 and December 2018, worldwide, by Pixability's count with Google (Think with Google, via Internet Archive). Buyers still look at brand content: in a 2018 Google/Kantar TNS survey of 500 recent U.S. car buyers, 74 percent of those who watched online video to inform their purchase watched branded video (Think with Google).
What video does for shoppers, by Google's own surveys:
In Google's 2011 study with Compete and R.L. Polk, 52% of U.S. new-vehicle buyers rated online video ads useful, the highest of nine ad types (Google Auto Shopper Behavior Study). Among buyers who used video sites, 65% watched car videos on YouTube (base 95) and 40% said video helped them decide which brand to buy (base 90).
In February 2016, one in four adults who had recently watched car content on YouTube on a smartphone to research a purchase said they would visit a dealer after watching; the base was 195 people (Think with Google).
In a January 2017 Google/comScore survey of 3,165 people who had bought a vehicle in the past three months, more than 40% of those who watched a video about cars or trucks visited a dealer as a result (Google Dealer Guidebook).
In an August 2018 Ipsos/Google survey of 673 U.S. shoppers, over 40% of those who used online video for research said it helped them discover a vehicle they had not been considering, and 40% used it to narrow their choice (Think with Google, via Internet Archive).
Google credits a six-week YouTube campaign by Fiat Chrysler and 300 Jeep dealers with more than 50,000 visitors to Jeep dealerships, measured by foot traffic with no published control group (Think with Google, via Internet Archive).
Each of these is a platform measuring interest in its own product. Google sells YouTube and search ads to automakers and dealers, and several bases are small subgroups of a survey.
TikTok, Snap and Reddit publish newer figures, each about its own users. In a TikTok-commissioned Escalent survey fielded August 18 to September 15, 2025, 75% of U.S. vehicle shoppers who used TikTok in their buying process used it for discovery, and 81% said it raised their interest in brands they had not known or considered (Escalent). Those are shares of TikTok-using shoppers, not of all car shoppers. TikTok cites GWI data that 37% of its adult users worldwide are in the market for a new or used vehicle (TikTok for Business), and says advertisers who tested its automotive inventory ads saw a 41% lower cost per acquisition than with its other shopping ad formats, from TikTok's internal U.S. data for October 2024 to January 2025 (TikTok for Business). Snap's 2025 survey of more than 5,000 social media users buying or shopping for a car in five countries found over 60% use social media during the journey (Snapchat for Business), and Reddit says 63% of car buyers in its 2024 survey of monthly Reddit users moved from consideration to purchase within three months (Reddit for Business).
The platforms are also becoming places to list and buy cars. Google's vehicle ads, which show dealer inventory in search results, are generally available in Australia, Canada and the US and in beta in parts of Europe and Japan, per its help page as captured on June 14, 2026 (Google Ads Help, via Internet Archive). Amazon Autos, which launched with new Hyundai vehicles in December 2024, had dealers in more than 130 U.S. cities by August 2025 (Amazon) and says it works with over 1,000 dealers (Amazon). Facebook said in 2017 that millions of Americans used Marketplace every day to look for cars, without giving a count (Meta).
What rules apply to car ads and dealer videos?
As of October 14, 2026 there is no federal rule written specifically for car dealer advertising, and the FTC enforces case by case. The FTC's CARS Rule, finalized in December 2023 with an estimated saving to shoppers of more than $3.4 billion and about 72 million hours a year (FTC press release), was due to take effect on July 30, 2024 but was postponed (Federal Register). The U.S. Court of Appeals for the Fifth Circuit vacated it on January 27, 2025 in a case brought by NADA, because the FTC skipped a required advance notice (Fifth Circuit opinion, No. 24-60013), and the FTC removed it from the Code of Federal Regulations with effect from February 12, 2026 (Federal Register). The FTC had valued the rule's benefits at $13.4 billion over ten years (present value at a 7% discount rate) against $1.1 billion in dealer compliance costs, and said it received more than 100,000 complaints a year about buying, financing and servicing vehicles (CARS Rule, Federal Register, January 4, 2024). Complaints are reports, not proven violations.
Enforcement against advertised prices has picked up. On March 13, 2026 the FTC sent warning letters to 97 auto dealership groups saying an advertised price must be the total price, including all mandatory fees (FTC), and on September 15, 2026 its staff published price-transparency answers for dealers that include how to state price across different media (FTC). In October 2026 the FTC alleged that Greenway Auto Group charged buyers more than $3,350 over the advertised price on average, in over 92% of sales; Greenway settled (FTC).
Case
Date
What the regulator alleged
Amount
Napleton Automotive Group (FTC and Illinois)
April 2022
Junk add-on fees and discriminatory financing
$10 million
Passport Automotive Group (FTC)
October 2022
Advertised prices inflated by mandatory fees
$3.38 million
Vroom (FTC)
July 2024
Inspection and delivery claims in advertising it did not meet
$1 million
Leader Automotive Group and AutoCanada (FTC and Illinois, proposed)
Falsely low advertised prices and unwanted add-ons; charges eligible for redress
$75 million
Swickard dealerships (Alaska Attorney General)
March 2026
Advertising unavailable vehicles and refusing advertised prices; civil penalty
$800,000
Manchester City Nissan (FTC and Connecticut)
August 2026
Charging to "certify" cars already advertised as certified pre-owned
$4 million
Sources: FTC press releases (Napleton, Passport, Vroom, Leader, Lindsay, Manchester City Nissan); Alaska Department of Law. Allegations are the regulator's; settlements are not admissions. The FTC called Leader's $20 million the largest monetary judgment it had secured against an auto dealer; its March 2026 release still described the case as pending. Lindsay's figure is the total charged that may qualify for redress, not a penalty; Lindsay pays a $3.1 million civil penalty to Maryland.
The FTC counted more than 50 auto-related enforcement actions in the ten years to October 2022 (FTC). In its August 2024 complaint against Asbury Automotive Group, it alleged that as many as 75 percent of customers surveyed at three Texas dealerships were charged for add-ons they had not authorized or were told were required (FTC). Consumer complaints to the CFPB about vehicle loans or leases rose from about 18,900 in 2024 to about 28,500 in 2025, up about 51% (Consumer Financial Protection Bureau; our calculation from rounded totals).
Testimonial and review videos fall under two FTC rules. The FTC's rule banning fake reviews and testimonials, including AI-generated ones and undisclosed insider testimonials, took effect on October 21, 2024 (16 CFR Part 465, Federal Register), and a knowing violation can cost up to $53,088 per violation (Federal Register). That ceiling was not raised for 2026: the FTC said the 2026 inflation adjustment was cancelled and the 2025 amounts continue (Federal Register). In December 2025 FTC staff warned 10 companies about possible violations of the review rule (FTC). The revised Endorsement Guides, which cover paid endorsements, influencer posts and customer testimonials, took effect on July 26, 2023 (16 CFR Part 255, Federal Register).
Lease and loan ads carry their own disclosures. Under Regulation M, a TV or radio lease ad that states a monthly payment can point viewers to a toll-free number instead of giving every disclosure on air, but the number must work for no fewer than ten days after the broadcast; the rule covers leases up to $73,400 in 2026 (12 CFR 1013.7, eCFR; 12 CFR 1013, eCFR). Under Regulation Z, a car-loan ad that states a down payment, number of payments, payment amount or finance charge must also state the terms of repayment and the annual percentage rate, using that term (12 CFR 1026.24, eCFR).
California's CARS Act takes effect on October 1, 2026. It requires dealers to show the total price in any ad that names a specific vehicle or financing terms, gives buyers a three-day right to cancel used vehicles priced at $50,000 or less, and requires dealers to keep records, including their ads, for two years (California Department of Motor Vehicles, OLIN 2026-10). The act sets no fine schedule of its own; the DMV says violations are enforced through existing law, including civil penalties of up to $2,500 per violation under the Unfair Competition Law. This section describes the rules as they stand on October 14, 2026 and is not legal advice.
What the popular automotive video statistics really say
Lists of "automotive video marketing statistics" lean on a small set of figures that Google published between 2015 and 2020, plus a few vendor numbers, and several changed meaning as they were copied. We traced the most repeated to the earliest document we could read. Pages that repeat a claim are linked only as dated evidence of how it changed, never as a source for the number.
"75% of auto shoppers say video influenced their purchase"
This comes from a Google survey of 400 people. Google reported that over 75% of U.S. auto shoppers said online video had influenced their "shopping habits or purchases", citing a Google/Ipsos study of people aged 18 to 64 who had bought a car in the past year, fielded in July 2018 (Think with Google, via Internet Archive). Any influence on habits counts, and nothing was measured beyond what people said. By March 2023 CBT News had it as 75% of auto shoppers saying "mobile video directly influenced their purchasing decision" (CBT News). A 2018 column by the chief operating officer of a dealer-video vendor set Google's 69% from 2015 beside the 75 percent from 2018 and called the gap "a 6-percent increase" (AutoSuccess), though the two figures come from different surveys of different people, and six points is not a 6% increase. Use it, if at all, as "over 75% of 400 recent buyers in 2018 said online video influenced their shopping".
"69% of car buyers who use YouTube are influenced by it more than by TV"
Google's November 2015 article says that of people who used YouTube while buying a car, 69% were influenced by it, more than by TV, newspapers or magazines (Think with Google). The base is people who already used YouTube, not all car buyers, and the only source named is a "TNS Media Consumption Report" with no year, sample or country. Digital Dealer restated it in December 2018 as 69% influenced "more than all other mediums" (Digital Dealer), widening Google's three comparison media to everything.
"Car buyers visit only 1.6 dealerships, down from five"
The report this is credited to does not contain 1.6. McKinsey's February 2014 report "Innovating automotive retail" said visits to dealers before buying had dropped "from up to 5 to frequently just 1" for some brands in some geographies, a range, not an average (McKinsey & Company). The 1.6 average first appears, as far as we found, in CNBC's report of February 26, 2014, which says "the McKinsey report says the average buyer visits just 1.6 auto dealerships" (CNBC). A dealer-video vendor's blog carries the same 1.6 with a 2013 date we could not confirm (Covideo). Google later joined McKinsey's "five" to a separate 2016 Google/TNS survey of 526 people as "used to visit five dealerships ... has dropped to two" (Think with Google, via Internet Archive).
Surveys that counted visits found two or more, not 1.6:
Survey
Who was asked
Dealerships visited, average
Google/TNS, 2015
500 U.S. car buyers
two
Facebook IQ/GfK, July 2017
1,500 car intenders and recent buyers in France, Germany and the UK
Two different studies have been fused. The 95% is Google's: in a January 2017 Google/comScore survey of 3,165 recent U.S. buyers, 95% used digital as a source of information, and twice as many started their research online as at a dealer (Think with Google, via Internet Archive). The 14 hours is Cox Automotive's, and it is the whole buying process, not online research: Cox's 2024 study timed it at 14 hours 19 minutes, of which 7 hours 13 minutes was online (Cox Automotive Car Buyer Journey topline). In 2026 one roundup credited "95% of vehicle buyers start research online, with an average of 14 hours spent across digital touchpoints" to Cox (Webtonic), and another said "95% of car buyers research online for an average of 14 hours and 19 minutes" (Demand Local).
"92% of auto shoppers use YouTube for vehicle research"
The original says nothing about YouTube. In Google/Kantar TNS's 2018 survey of 500 recent U.S. car buyers, 92% said they research online before they buy, on any website (Think with Google, via Internet Archive). A 2025 dealer-marketing roundup turned it into "92% of auto shoppers use YouTube for vehicle research" (Demand Local). The best recent measure of YouTube use is Strategic Vision's 18.3% of new-vehicle buyers in 2024.
"75% of vehicle research now happens digitally"
This describes 2015. Google wrote in October 2016 that shoppers performed 75% of their car research on digital, citing a Millward Brown Digital and Polk study from September 2015, with no sample size given (Think with Google). A 2026 roundup presents the same figure as "75% of vehicle research now happens digitally" (Demand Local).
"Test-drive video watch time on YouTube grew 70%"
Google's figure is 65%: watch time of "test drive" videos on YouTube in the U.S. grew by more than that between April 2016 to March 2017 and April 2018 to March 2019 (Think with Google, via Internet Archive). The over 70% was mobile watch time only, in the same period (Think with Google). A 2025 Digital Dealer article said test-drive watch time grew "by over 70 percent" over "the past two years" (Digital Dealer), dropping the mobile qualifier from a two-year period that had ended six years earlier.
"60% of car shoppers visit a dealership after watching a video"
In Ipsos/Google's August 2018 survey of 673 U.S. auto shoppers, over 60% of those who used video in their research reported visiting a dealership or a dealer website after watching a video of a vehicle they were considering (Think with Google, via Internet Archive). The base is shoppers who already used video, a mix of buyers and people still shopping, and the outcome includes a website visit. A 2025 roundup headlined it as "60% of auto shoppers visit a dealership after watching a video of the vehicle" (Demand Local), dropping both qualifiers.
"64% of shoppers would buy a car without a test drive after a 360-degree video"
This is a hypothetical. In Google/Kantar TNS's 2018 survey of 500 recent buyers, 64% of those who watch online videos to inform their purchase said new formats like 360-degree video would convince them to buy a car without a test drive (Think with Google, via Internet Archive); the size of that subgroup is not given. A 2025 roundup dropped the base: "64% of shoppers say 360-degree videos would convince them to buy without test drives" (Demand Local). What buyers actually did is different: in CarGurus' 2025 survey, 69% took their test drive in person only.
"80% of new car buyers take action after watching a video"
In Google/Kantar's 2020 Gearshift study of 1,000 U.S. new-vehicle buyers, 80% took an action after watching a video, where an action could be searching online for more information, visiting a dealer website, scheduling a test drive, or building and pricing a vehicle (Google Dealer Guidebook 2.5). Searching for more information is the lowest bar a viewer can clear, and none of the listed actions is a showroom visit or a purchase. A 2026 roundup restated the 80% as buyers "visiting a dealership, requesting a quote, or researching further" (Webtonic), adding two actions Google did not list.
"The average car buyer has 900+ digital interactions"
The 900 describes one person. Google's study followed a single Luth Research panelist, "Stacy", whose research in the three months before leasing an SUV "included over 900 digital interactions" (Think with Google). Google's own methodology note says the article details the clickstream data of one individual. It is not an average.
"19% of TikTok users bought a new car after seeing it on TikTok"
The figure sits on TikTok's U.S. automotive page, but its footnote sources it to a February 2022 Toluna study of 4,320 TikTok users and non-users in Southeast Asia: "19% of users bought a new car after seeing it on TikTok" (TikTok for Business). It does not describe U.S. car buyers, and the question wording is not published.
"Shoppers spend 44% more time on dealer sites with vehicle videos"
This is a video vendor measuring its own customers. LESA Automotive, which sells walk-around videos to dealers, reported in September 2021 that consumers spent 44% more time on dealer websites where its vehicle videos were available, from a before-and-after look at 100 of its dealer customers with no control group or field dates (LESA Automotive release, published by Digital Dealer). A 2026 roundup presents "44% more time on dealer websites with vehicle videos" as a general fact (Webtonic). The nearest platform-owner figure is smaller and dated: Cox Automotive reported that vehicles listed with videos on Autotrader had 13% more detail-page views in late 2016, a comparison of listings, not a test (Cox Automotive).
"NADA says dealers will spend $672 per car on digital ads" and "video will influence half of car sales by 2027"
We found neither in any NADA publication. Both appear in a July 2026 roundup, along with a claim that Cox Automotive data shows electric-vehicle shoppers watch "40% more video content" (Webtonic). NADA publishes total advertising per new vehicle sold as a historical average for franchised dealers, $739 in 2025, with no digital-only per-vehicle figure and no forecast, and Cox's 2024 Car Buyer Journey release says only that EV buyers are "more likely" to watch expert and test-drive videos. We searched NADA's annual and midyear reports and press releases, Cox's newsroom and Car Buyer Journey toplines from 2019 to 2025, and the trade press, and found no original for any of the three.
How we built this page
We started from the questions people search for about automotive video marketing statistics and looked for the organization that actually produced each answer. Every figure on this page sits in an evidence ledger with its source, the exact table or paragraph it came from, the measurement period, the population measured, and the date we checked it. This edition holds 252 figures from 43 publishers.
On October 14, 2026, each of the 218 sourced figures on this page that has a web source was re-fetched with the fetch cache cleared and matched against the recorded wording, and the 11 BLS occupational estimates were checked against their series in the BLS public data API. Pages that have moved or block automated requests, including Think with Google, J.D. Power's press releases and a Google Ads help page, were checked against dated Internet Archive copies. We left out what we could not re-check or could not use: the NIADA Used Car Industry Report, which is sold; Borrell Associates' dealer ad-spend estimates and Automotive News Data Center figures, which sit behind paywalls; the FTC's counts of auto-related complaints by category, published only in a data file we could not check against its text; Cox Automotive's 2015 consumer video study, which publishes no sample size or dates; a Kantar figure on Snapchat car shoppers with no published method; and the full TikTok and Escalent report, which is handed out through a sign-up form. The Census Bureau collects car dealers' e-commerce sales and purchased advertising but withholds both, so no government figure for either appears here.
We only cite the producer: government agencies, regulators, company filings and official posts, and the survey owner's own report. We do not cite statistics roundups, Statista-style aggregators, or salary sites without a public method. We did not bypass paywalls or sign-up forms; where a full report was gated, we used only the figures its publisher states publicly.
Figures marked "our calculation" are arithmetic on the cited numbers, and anyone can reproduce them:
This edition contains no Mark Studios customer data.
Limitations
No source measures what car dealers spend on video. NADA reports dealer advertising by medium with no line for online video, connected TV or YouTube; the public retailers report advertising in total; and the Census Bureau withholds dealers' purchased-advertising and e-commerce figures.
Companies define advertising differently. Some report it net of manufacturer support and some include stores outside the U.S. The per-vehicle table is our arithmetic on each company's own figures, so compare the range, not small gaps.
Most shopper and platform figures come from organizations with an interest. Cox Automotive, CarGurus, Cars.com and Autotrader sell listings and marketing to dealers; J.D. Power and Strategic Vision sell research to automakers and dealers; Google, TikTok, Snap, Reddit and Meta sell advertising; Capital One lends to car buyers. The government sources do not sell into the market.
Many of the most quoted video figures are old or rest on small groups. Google's car video studies date from 2011 to 2020, and several figures rest on subgroups of 90 to 400 people. Each is labelled with its year and base.
Dealer counts depend on the definition. A franchise, a location with paid staff and a business with no staff are different units, so the page shows each count with its definition rather than choosing one.
Most figures describe the U.S. Autotrader's figures are for the UK, Snap's survey covers five countries, Facebook IQ's dealer-visit figure covers France, Germany and the UK, and TikTok's "19% bought a new car" comes from Southeast Asia; each is labelled.
Rules change. The rules section describes federal and California rules as they stood on October 14, 2026. It is not legal advice.
Mark Studios. "Automotive Video Marketing Statistics." Last verified Oct 14, 2026. https://www.markstudios.com/research/automotive-video-marketing-statistics
Our calculations and the evidence table are free to reuse with attribution and a link to this page. Each underlying figure remains the claim of its original publisher, and some publishers ask for a link when their figures are reused.
We re-verify every figure quarterly and when a major source publishes a new edition. The next scheduled review is January 2027. Corrections go to contact@markstudios.com.
Oct 14, 2026: First published with 252 figures from 43 publishers, each checked against its original source.
Frequently asked questions
How much do car dealers spend on advertising?
U.S. franchised dealerships spent $9.96 billion on advertising in 2025, by NADA's count: $586,246 per dealership on average and $739 for every new vehicle sold. In the first half of 2026 the figure rose to $791 per new vehicle. Public retailers' filings show from about $206 to $608 per vehicle retailed, by our calculation.
How much of car dealer advertising goes to digital and video?
About three quarters goes to digital. Search ads, third-party listing sites, websites and social media made up 74.8% of the average franchised dealership's advertising in 2025, and social media alone 14.2%. No source publishes a figure for video: NADA has no video line, and the public retailers report advertising in total. Lithia & Driveway says over 88% of its advertising went to digital, social, listings and owner communications.
How many car buyers use video when shopping?
A minority name it as a source. In Strategic Vision's 2024 study, 18.3% of new-vehicle buyers cited YouTube and 2.2% TikTok. In J.D. Power's 2016 study, 13% of new-vehicle internet shoppers used YouTube. Google's often-quoted claim that over 75% of auto shoppers say video influenced them comes from a July 2018 survey of 400 recent buyers and counts any influence on shopping habits or purchases.
How many car dealerships are there in the U.S.?
It depends on what is counted. NADA counted 16,990 franchised new-car dealerships at the end of 2025. The Census Bureau counted 21,910 new car dealer locations and 25,147 used car dealer locations with paid employees in 2023, plus 126,322 used car dealers with no employees in 2024.
How long do people spend shopping for a car?
Cox Automotive's 2024 Car Buyer Journey study timed the whole process at 14 hours 19 minutes. In its 2025 study, buyers spent 7 hours 11 minutes researching and shopping online. CarGurus' 2025 survey found buyers visited 2.1 dealerships on average.
What are the FTC rules for car dealer ads?
There is no federal rule written for car ads as of October 2026: the FTC's CARS Rule was vacated by the Fifth Circuit on January 27, 2025. The FTC enforces case by case and warned 97 dealer groups in March 2026 that an advertised price must include all mandatory fees. Its rule against fake reviews and testimonials, in force since October 21, 2024, applies to dealer testimonial videos, with penalties of up to $53,088 per violation. This is not legal advice.
How often is this page updated?
Every figure is re-checked against its original source each quarter, and sooner when a major source publishes a new edition, such as NADA Data each spring or Cox Automotive's Car Buyer Journey study. The Last verified date changes only after that check, and each change is recorded in the change log.