Every figure on this page links to the organization that produced it, and each was re-checked against that source before publishing. How many law firms there are and how small most of them are, how many make marketing video, what legal advertisers spend on TV, how people find a lawyer and how many look for video, what bar rules require of lawyer video ads, and which popular legal video statistics don't hold up.
The Census Bureau counted 181,092 legal services establishments with paid staff in 2023, and 71.8% of offices of lawyers had fewer than five employees. (U.S. Census Bureau; our calculation)See details
26% of lawyers in private practice said their firm produced marketing video in 2024: 41% at firms of 100 or more lawyers, 17% of solos. (ABA Legal Technology Survey)See details
That share has stayed between 24% and 31% in every ABA survey since 2019. (ABA Legal Technology Survey)See details
Marketing and creative roles were about 1.1% of the 1,224,710 jobs in legal services in May 2025, and BLS publishes no count of video editors in the industry. (BLS; our calculation)See details
Legal advertisers spent $1,033,709,263 on TV in 2024, at most about 41% of the legal advertising ATRA measured. (ATRA, Vivvix data; our calculation)See details
In FindLaw's 2024 survey, one in six people who looked for legal information online searched for videos and 79% of them used YouTube: about 13% of online legal researchers. (FindLaw; our calculation)See details
TV and radio rose from 35.8% of the lawyer ads The Florida Bar reviewed in 2007-08 to 46.7% in 2018-19. (The Florida Bar; our calculation)See details
'Video marketers grow revenue 49% faster' is a 2015 Aberdeen survey of companies in general: 13.3% growth against 8.9%, a ratio of 1.49. (Aberdeen via MediaPost; our calculation)See details
How big is the U.S. legal services industry?
The Census Bureau counted 181,092 legal services establishments with paid employees in the United States in 2023, employing 1,190,297 people in mid-March and paying $144,007,740 thousand (about $144 billion) in annual payroll (U.S. Census Bureau, County Business Patterns). Almost all of them are offices of lawyers: 165,491 establishments with 1,093,331 employees (U.S. Census Bureau). Offices of lawyers with paid staff took in $356,046,433 thousand in revenue in 2022, about $356 billion (U.S. Census Bureau, 2022 Economic Census).
Most law offices are small. Of those 165,491 offices, 118,754 had fewer than five employees and 24,921 had five to nine (U.S. Census Bureau). That puts 71.8% of offices of lawyers under five employees and 86.8% under ten (our calculation). Another 274,000 legal services businesses had no employees at all in 2023, down from 283,944 in 2022 (U.S. Census Bureau, Nonemployer Statistics; 2022). Counted together with employer establishments, about 60.2% of legal services businesses have no staff (our calculation; approximate, because the two series count slightly different units).
How many lawyers there are depends on who counts. The ABA's National Lawyer Population Survey, compiled from state bar and court records, counted 1,377,600 resident active lawyers in 2025 (American Bar Association). Its 2025 edition restates 2024 as 1,358,824 after states revised their counts; the 2024 edition had reported 1,322,649 (ABA, 2025; ABA, 2024). BLS counts jobs rather than licences: about 863,700 lawyer jobs in 2025 including the self-employed, of which 754,500 were wage and salary jobs paying an annual mean wage of $185,840 (BLS Occupational Outlook Handbook; BLS OEWS; BLS OEWS). Legal services firms employed 52% of lawyers. BLS projects lawyer employment to grow 5% from 2025 to 2035, with about 28,700 openings a year, and paralegal employment to show 0% change (BLS; BLS; BLS; BLS).
In Florida, the ABA counted 80,976 resident active lawyers in 2025, and the Census Bureau 17,261 offices of lawyers with paid employees in 2023 (American Bar Association; U.S. Census Bureau).
How many marketing and video staff work inside law firms?
Very few. BLS estimated 1,224,710 wage and salary jobs in the legal services industry in May 2025, including 448,040 lawyers and 304,820 paralegals and legal assistants (BLS OEWS; BLS OEWS; BLS OEWS). Against that, it counted 3,260 marketing managers, 8,080 market research analysts and marketing specialists, 1,990 public relations specialists, 440 graphic designers and an estimated 30 producers and directors (BLS OEWS; BLS OEWS; BLS OEWS; BLS OEWS; BLS OEWS). Together those marketing and creative roles are about 1.1% of the industry's workforce (our calculation). BLS publishes no estimate at all for film and video editors in legal services.
Seen from the other side, legal services employ about 0.9% of the country's 899,580 market research analysts and marketing specialists (BLS OEWS; our calculation). The producers and directors estimate is rough: BLS gives it a relative standard error near 30%. OEWS leaves out the self-employed and owners, and BLS advises against comparing its estimates across years. Few firms employ anyone whose job is marketing, let alone video. The Census Bureau's figure for advertising that firms buy from outside providers is in the spending section below.
How many law firms make marketing video?
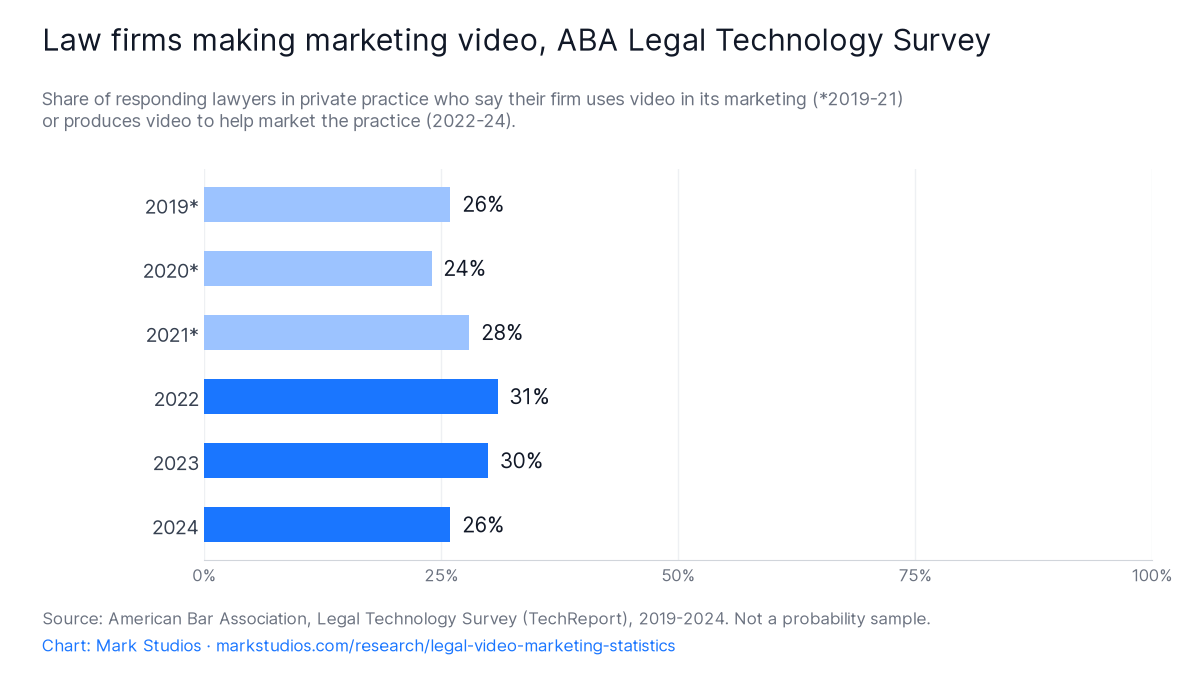
About a quarter. In the ABA's 2024 Legal Technology Survey, 26% of responding lawyers in private practice said their firm produced video to help market the practice (American Bar Association). The share has stayed between 24% and 31% in every edition since 2019:
ABA Legal Technology Survey
Respondents saying their firm uses or produces marketing video
Sources: ABA TechReport marketing articles for 2019, 2020, 2021, 2022 and 2023, read through Internet Archive copies. The 2019 to 2021 question asked whether firms use video in their marketing; from 2022 it asks whether firms produce video to help market the practice. Respondents are lawyers answering for their firms, not a probability sample, and the free articles do not publish sample sizes.
Law firms making marketing video, ABA Legal Technology SurveyShare of responding lawyers in private practice. The 2019 to 2021 question (lighter bars, marked *) asked whether the firm uses video in its marketing; from 2022 it asks whether the firm produces video to help market the practice, so the two periods are not strictly comparable.
Uses video in its marketing (2019 to 2021)
Produces video to help market the practice (2022 to 2024)
Firm size decides it. In 2024, 41% of respondents at firms of 100 or more lawyers said their firm produced marketing video, against 17% of solo practitioners (ABA; ABA). In 2022 the large-firm figure was 47%, with every other firm size under 25% (ABA).
Where the video lives tells a similar story. Among 2023 respondents whose firms make video, 46% said it was hosted on YouTube, second to the firm's own website (ABA). But only 10% of 2024 respondents said they maintain a presence on YouTube, and in 2022 just 3% named YouTube among the other channels their firms market through (ABA; ABA). For most firms a video is something placed on the website, not a channel they run.
The web presence underneath is close to universal. 90% of 2024 respondents said their firm had a website, including 70% of solos, and 80% used social media for marketing (ABA; ABA; ABA). The ABA's own documents disagree on LinkedIn, the top platform: 76% in its TechReport and 78% in its press release on the same survey; Instagram was at 22% (ABA TechReport; ABA press release). In 2022, 37% said their firms had blogs (ABA Profile of the Legal Profession).
In Florida, most lawyers in private practice do not advertise at all. In The Florida Bar's 2024 membership survey, 30% of respondents in private practice said their firm or office advertises, up from 26% in 2021 (The Florida Bar, 2024; 2021). In its 2022 economics survey, 39% of members said their firm's website was contracted to and maintained by an outside company (The Florida Bar). In Michigan's 2023 survey, 319 private practitioners named social media as a top-three source of new business, far fewer than named client referrals or referrals from other lawyers (State Bar of Michigan).
What do lawyers and law firm marketers say about video and TV ads?
Lawyers themselves rate the most visible legal video, the TV ad, poorly. In The Florida Bar's 2024 membership survey, 43% of members named television as the form of lawyer advertising that most hurts the public's view of lawyers, the most common answer (The Florida Bar).
Budgets are growing at the firms that report them. In the Legal Marketing Association and Above the Law's 2025 survey of nearly 100 law firm marketing and business development leaders, 54% said their budgets had increased in recent years after adjusting for inflation (Above the Law). Rankings.io, an agency that sells marketing to law firms, found 69% of respondents at firms of 1 to 25 employees expected their marketing budget to rise over the next 12 months (Rankings.io). Clio, which sells practice-management software, reports from its customer data that firms with above-average billable utilization spend 41% more on marketing; that is a correlation, not an effect of marketing (Clio).
The two surveys most often quoted on whether video works for law firms are not on this page. CallRail's 2026 Legal Marketing Outlook Report and the full LMA and Above the Law Legal Marketing Decision-Makers report are both handed out through sign-up forms, and this page uses only figures a publisher states publicly. Above the Law's public summary of the LMA survey does not report its video results.
How much do law firms spend on advertising, and how much goes to TV?
Published estimates of U.S. legal advertising run from about $2.5 billion to $9.3 billion a year, because each one counts something different:
Estimate
Year
What it counts
Source
More than $2.5 billion
2024
Measured ads for legal services or soliciting legal claims on TV, radio, print, out-of-home and digital; social media excluded
ATRA campaigns for limits on litigation; AdImpact and BIA sell media data and forecasts to advertisers and broadcasters. Only the Census figure comes from a survey of the firms themselves, and it does not split spending by medium.
TV is the largest single medium. ATRA puts 2024 TV spending on legal-services ads at $1,033,709,263, at most about 41% of all the legal advertising it measured (ATRA; our calculation). Digital was second at $725,668,400 (ATRA). On average, 83% of legal TV dollars from 2017 to 2024 went to local spot TV rather than national networks, and the number of legal TV ads peaked in 2023 at more than 16.4 million (ATRA; ATRA). The largest spot-TV advertiser, Morgan & Morgan, spent $110,730,412 on local spot TV in 2024 (ATRA).
AdImpact reports that legal ads took 6.1% of all available impressions on U.S. local broadcast TV from 2023 through 2025. Streaming is growing from a small base: legal connected-TV spending grew 241% over two years, yet connected TV was only 2.7% of legal ad impressions (AdImpact). BIA's forecasters say law firms keep investing heavily in linear and streaming TV ($9.3 billion forecast for 2026).
Business groups have tracked lawyer TV spending for a decade. The U.S. Chamber Institute for Legal Reform, which campaigns against plaintiffs' litigation, projected in 2015 that lawyers would spend $892 million on TV that year, and in 2020 counted more than $400 million of TV advertising across five mass-tort litigations alone, using Kantar CMAG data (Institute for Legal Reform, 2015; 2020).
The broadest measure is the Census Bureau's. Legal services employer firms bought $9,284,140 thousand of advertising and promotional services in 2024, about 3.5% of their $267,899,616 thousand in total operating expenses (U.S. Census Bureau; our calculation). The same survey put 2023 at $5,019,776 thousand, a rise of about 85% in a year (U.S. Census Bureau; our calculation). The Annual Integrated Economic Survey began with 2023 data, so treat that jump with caution until a third year is published.
One legal brand reports its advertising to the SEC. LegalZoom's advertising expense, mostly search, television and social media, was $175.6 million in 2025 on revenue of $756.0 million, about 23.2% of revenue; in 2024 it was $157.6 million on $681.9 million, about 23.1% (LegalZoom 10-K, 2025; 10-K, 2024; our calculations). Its total sales and marketing expense was $261,745 thousand in 2025 (LegalZoom 10-K). Ad-monitoring data catch only part of that: ATRA's Vivvix figures put LegalZoom's 2024 measured advertising at $59,749,138, well under the 10-K figure, because monitored media leave out social media and estimate search only for the largest advertisers (ATRA). Treat the monitored totals in the table above as floors.
Large firms' overhead, which includes marketing and business development, is also rising. Thomson Reuters' Law Firm Financial Index found overhead expenses up 7.7% year over year in the second quarter of 2026, and its State of the US Legal Market report put 2025 growth in overhead per lawyer at 4.3% (Thomson Reuters Institute; Thomson Reuters Institute). Thomson Reuters does not publish marketing spend separately.
How do people find a lawyer, and do they watch legal video?
Most people with a legal problem never hire anyone. The Legal Services Corporation's 2022 Justice Gap study found 74% of low-income households had at least one civil legal problem in the past year. They sought legal help for only 25% of the problems that substantially affected them and got no or not enough help for 92%, and 53% did not know whether they could find and afford a lawyer (Legal Services Corporation). Across all incomes, IAALS and HiiL found 66% of Americans had at least one legal issue over four years (IAALS). Among people who looked for information or advice on their most serious problem, 31% used the internet, the most common source, and 29% a lawyer (IAALS and HiiL).
Video is a minority route into legal information, and mostly a YouTube one. In FindLaw's 2024 survey of 2,000 U.S. adults with a recent legal need, one in six of those who looked for legal information online searched for videos, and 79% of them used YouTube (FindLaw). That works out to roughly 13% of online legal researchers watching legal video on YouTube (our calculation). FindLaw's own posts disagree on how many found videos on law firm or attorney websites: 58% in October 2024 and 69% in December 2024 (FindLaw, October; FindLaw, December). FindLaw, part of Thomson Reuters, sells marketing to law firms.
Search and reviews do most of the work. In the same survey, 97% of respondents who researched the attorney they contacted used search engines, 82% of those who found an attorney online relied on reviews, and 59% contacted only one attorney before hiring (FindLaw; FindLaw; FindLaw). Scorpion, which sells marketing and intake technology to law firms, found in a 2025 survey of 3,000 U.S. adults that 74% of legal clients research a firm even after a referral and 72% move on if a firm does not reply within 24 hours (Scorpion; Scorpion).
That is a recent change. In an ABA-commissioned Harris poll in September 2010, 46% said asking a friend, family member or colleague would be their main way to find a lawyer, and only 7% said searching online (American Bar Association; ABA).
YouTube itself reaches most adults. Pew Research Center found 84% of U.S. adults use it and 33% visit several times a day (Pew Research Center; Pew), and in 2018 that 35% of all adults called it very important for learning how to do things they had never done before (Pew Research Center). Reach is not legal research; for how many people actually watch legal video, the FindLaw figure is the better guide.
What do bar rules require of lawyer video ads?
Lawyer advertising is regulated state by state, and video ads follow the same rules as any other ad. Most states base their rules on the ABA Model Rules of Professional Conduct, adopted in 1983 (American Bar Association). The ABA rewrote the advertising rules, 7.1 to 7.5, with Resolution 101 on August 6, 2018 (ABA). Some states go further and make lawyers file their ads with the bar:
State
When to file
Fee
Bar's review time
Keep a copy for
Florida
At least 20 days before first use
$250; $750 if late (from July 1, 2026)
15 days, after which the lawyer is not subject to discipline for the ad unless later notified
Florida has screened broadcast ads longest. Under rules that took effect on January 1, 2007, TV and radio ads with more than basic information had to reach the Bar at least 15 days before they aired (The Florida Bar News). On July 1, 2026 the timely filing fee rose from $150 to $250, about 67% (our calculation) and the first increase in 20 years (The Florida Bar News, 2006; 2026).
Florida is also the only bar here that has published how many of the ads it reviews are broadcast. TV and radio have grown from about a third to almost half:
Florida Bar year
Lawyer ads reviewed
TV and radio ads
TV and radio share
2007-08
3,688
1,319
35.8%
2013-14
3,715
1,575
42.4%
2018-19
4,467
2,087
46.7%
2022-23
Nearly 4,000
Not published
2023-24
Nearly 3,000
Not published
2024-25
More than 3,000
Not published
Sources: The Florida Bar News, November 2008, July 2019 (2013-14 and 2018-19), June 2023, August 2024 and April 2026. Shares are our calculation. 2018-19 was the busiest year since the review program began in 1992.
Behind those filings is a small pool of advertisers: about 1,400 lawyers and law firms a year submitted ads to The Florida Bar in the three years to 2014 (The Florida Bar News). In Texas, the State Bar's advertising review staff and committee handle about 3,200 submissions a year, mostly TV and internet ads (Texas Bar Journal).
Enforcement elsewhere is mostly complaint-driven. In a 2014 survey of lawyer regulators by the Association of Professional Responsibility Lawyers, only 17% of responding jurisdictions said they actively monitor lawyer ads, and 78% said most complaints about lawyer advertising came from other lawyers (APRL; APRL).
What the popular legal video marketing statistics really say
Most lists of "law firm video marketing statistics" recycle a handful of general marketing figures from 2008 to 2015, plus a few genuinely legal ones that have lost their population. We traced eight of the most repeated to the earliest document we could read. Pages that repeat a claim are linked only as dated evidence of how it changed, never as a source for the number.
"Marketers who use video grow revenue 49% faster"
This is a 2015 survey of companies in general, not law firms. Aberdeen Group surveyed 168 companies; those using video in at least one marketing channel reported revenue growth of 13.3% against 8.9% for those that did not (MediaPost, reporting Aberdeen Group). 13.3 divided by 8.9 is 1.49 (our calculation), which is where "49% faster" comes from. It is self-reported growth, and it shows that companies doing video marketing grew faster, not that video caused it. Vidyard, the video platform that distributed the research, promoted it as marketers growing revenue 49% faster (Vidyard). The earliest legal-sector use we found, a guest comment in Legal IT Insider in April 2019, still credited the 49% to video users in general (Legal IT Insider). By 2022 a law firm video production page presented it as a benefit law firms get from video, and a 2026 personal-injury roundup had turned it into law firm conversion rates rising 49%.
A companion figure has the same origin. "Video converts at 4.8% against 2.9% without" comes from Aberdeen's own November 2014 blog post: companies that adopted video content reported website conversion rates averaging 4.8% against 2.9% for those that did not (Aberdeen Group). Again, these are companies in general, self-reporting.
"Video on a landing page lifts conversions 86%"
This is one vendor's best client result. EyeView Digital reported an improvement in conversion of over 86 percent for one client, TutorVista, after several rounds of testing, measured against the client's original landing page (EyeView Digital, via Internet Archive). It is neither an average nor legal data. Our video advertising statistics page traces the 80% and 86% versions in full, including the one test EyeView described in detail, which found a much smaller lift. A law firm digital agency was presenting the 86% in the UK legal press as a general effect of landing-page video by January 2015.
"96% of people seeking legal advice use a search engine"
True only of people who were already searching online. The figure comes from a 2014 Google and FindLaw infographic: "96% of people seeking legal advice use a search engine when looking online", from Google Consumer Surveys of U.S. residents in November 2013 (Google and FindLaw, via Internet Archive). The same infographic held two different 74% figures, 74% who visit a law firm's website to take action and 74% who contact attorneys by phone, which later lists merged into one (Google and FindLaw). A November 2025 roundup still presents the 96% as the share of everyone seeking legal advice.
FindLaw's own survey from the same year gives a much lower figure for the whole public: 38% of 1,000 American adults said they would use the internet to help find a lawyer (Thomson Reuters). That was a question about what people would do, not what they did. For the older baseline, see the ABA's 2010 poll, where 7% named online search as their main way to find a lawyer.
"1 in 5 (or 25%) of people researching legal topics use YouTube"
The only legal-specific YouTube figure in that infographic is 1 in 5 people researching legal topics visiting YouTube during their process, sourced to YouTube internal data for 2012 with no method published (Google and FindLaw). A list of legal marketing statistics republished by the National Law Review in October 2015 turned it into 25%, citing the same source. For a current figure, FindLaw's 2024 survey puts it at about 13% of people looking for legal information online.
"Viewers retain 95% of a video message, 10% of text"
Insivia, the agency the line is credited to, now says it came from a small survey it ran more than 16 years ago and was not a peer-reviewed study: viewers retain 95% of a video message but only 10% of text (Insivia). It still appears in material sold to attorneys, such as an October 2024 press release. The full trace is on our video advertising statistics page.
"One minute of video is worth 1.8 million words"
This line is credited to Forrester analyst James McQuivey, but the 2008 Forrester report it is usually pinned to, "How Video Will Take Over The World", is summarised by Forrester as a forecast that video viewing would rise from 4 to 5 hours a day by 2013, with no words-per-minute claim (Forrester Research, via Internet Archive). The full report is paid and we did not read it. The figure matches proverb arithmetic: a picture worth a thousand words, multiplied by the frames in a minute of video. The State Bar of Texas's own journal repeated it to lawyers in October 2024.
"Video is 53 times more likely to rank on page one"
Forrester's January 2009 analysis compared a single video with a single text page, on 40 popular keywords where Google already showed video results: any given video stood "about a 50 times better chance" of reaching the first page (Forrester Research, via Internet Archive). Trade press reported it as 53 times in April 2009, still with that scope (Chief Marketer). By March 2013 a legal marketing article had turned it into a website with video being 53 times more likely to reach page one than a website without, a comparison Forrester never made. The analysis also predates more than a decade of changes to Google's results pages.
"Most clients prefer a lawyer with video"
We found no survey that says this. The only survey we found that asked consumers whether a lawyer's video would help them choose, run for WebVisible by Synovate in 2011 among 1,000 Americans, found 16% picked a video profile of the attorney or practice as information that would help them decide, far behind credentials and experience (WebVisible). WebVisible sold online advertising to local businesses, law firms included.
How we built this page
We started from the questions people search for about legal video marketing statistics and looked for the organization that actually produced each answer. Every figure on this page sits in an evidence ledger with its source, the exact table or paragraph it came from, the measurement period, the population measured, and the date we checked it. This edition holds 180 figures from 34 publishers.
On October 2, 2026, each of the 164 sourced figures on this page was re-fetched from its source with the fetch cache cleared and matched against the recorded wording, and the 11 BLS occupational estimates were checked against their series in the BLS public data API. Pages that block automated requests, including americanbar.org, findlaw.com, clio.com and scorpion.co, were checked against dated Internet Archive copies. We left out what we could not re-check or could not use: CallRail's 2026 Legal Marketing Outlook Report and the full Legal Marketing Association and Above the Law Legal Marketing Decision-Makers report, which are both handed out through sign-up forms; Clio's 2019 consumer findings, for the same reason; a Clio figure on online video ads that exists only inside a chart image; Hinge Research Institute's legal High Growth Study, which is sold; and the Institute for Legal Reform's 2017 advertising report, whose only archived copy is empty.
We only cite the producer: government agencies, regulators, company filings and official posts, and the survey owner's own report. We do not cite statistics roundups, Statista-style aggregators, or salary sites without a public method. We did not bypass paywalls or sign-up forms; where a full report was gated, we used only the figures its publisher states publicly.
Figures marked "our calculation" are arithmetic on the cited numbers, and anyone can reproduce them:
This edition contains no Mark Studios customer data.
Limitations
No source measures what law firms spend on video. The Census Bureau counts advertising bought from outside providers, without a split by medium and without in-house marketing pay. Ad-monitoring firms count TV and measured digital ads, not production or organic video.
Most figures about lawyers' marketing come from organizations with an interest. FindLaw (Thomson Reuters), Scorpion, Rankings.io and Clio sell marketing or software to law firms; AdImpact and BIA sell media data; the American Tort Reform Association and the U.S. Chamber Institute for Legal Reform campaign to limit litigation. The government sources count businesses, jobs, pay and purchases, not video.
The ABA's video figures are not a probability sample. Lawyers answer for their firms, so a large firm with many respondents counts more than once, the free reports do not publish sample sizes, and the question changed from using video in marketing (2019 to 2021) to producing marketing video (2022 on).
Ad-spend estimates disagree because they count different things. Monitored totals leave out social media and estimate search only for large advertisers; forecasts are forecasts; the Census survey of firm expenses began with 2023 data and its first two years differ by 85%.
Some consumer figures are hypothetical or narrow. The ABA's 2010 poll and FindLaw's 2014 survey asked what people would do, not what they did; the Legal Services Corporation's study covers low-income households only.
Bar rules change, and only a few states are shown. The table covers six states as their rules read on the access date. It is not legal advice.
Two widely quoted legal marketing surveys are missing. CallRail's and the Legal Marketing Association and Above the Law's reports are distributed through sign-up forms, so their figures on video are not used here.
How to cite this page
For a single figure, cite the original publisher named next to it, and link here if the verification trail is useful to your readers. Each figure has its own anchor, so you can link straight to it, for example https://www.markstudios.com/research/legal-video-marketing-statistics#ADO-001. To cite the page as a whole:
Mark Studios. "Legal Video Marketing Statistics." Last verified Oct 2, 2026. https://www.markstudios.com/research/legal-video-marketing-statistics
Our calculations and the evidence table are free to reuse with attribution and a link to this page. Each underlying figure remains the claim of its original publisher, and some publishers ask for a link when their figures are reused.
U.S. Bureau of Labor Statistics (Occupational Outlook Handbook / Employment Projections), Lawyers: Occupational Outlook Handbook (not printed; page captured 2026-09-28). Accessed 2026-10-02.
The Florida Bar (The Florida Bar News, figures compiled by the Ethics and Advertising Department), Lawyers increasingly turning to advertising (2008-11-01). Accessed 2026-10-02.
The Florida Bar (The Florida Bar News, statistics compiled by the Ethics and Advertising Department), Bar reviewing more lawyer ads (2019-07-31). Accessed 2026-10-02.
The Florida Bar (The Florida Bar News), The Bar by the numbers (2023-06-14). Accessed 2026-10-02.
We re-verify every figure quarterly and when a major source publishes a new edition. The next scheduled review is January 2027. Corrections go to contact@markstudios.com.
Oct 2, 2026: First published with 180 figures from 34 publishers, each checked against its original source.
Frequently asked questions
What percentage of law firms use video marketing?
About a quarter. In the ABA's 2024 Legal Technology Survey, 26% of lawyers in private practice said their firm produced video to help market the practice, from 41% at firms of 100 or more lawyers to 17% of solo practitioners. The share has stayed between 24% and 31% since 2019.
How much do law firms spend on TV advertising?
The American Tort Reform Association, using Vivvix ad-monitoring data, puts 2024 U.S. TV spending on legal-services ads at $1,033,709,263, out of more than $2.5 billion of measured legal advertising. On average, 83% of legal TV dollars from 2017 to 2024 went to local spot TV.
How much do law firms spend on advertising in total?
The Census Bureau's Annual Integrated Economic Survey reports that legal services employer firms bought $9,284,140 thousand (about $9.3 billion) of advertising and promotional services in 2024, about 3.5% of their operating expenses. Ad-monitoring estimates are lower because they leave out social media.
Do people watch videos when looking for a lawyer?
Some do. In FindLaw's 2024 U.S. Consumer Legal Needs Survey, one in six people who looked for legal information online searched for videos, and 79% of them used YouTube. Search engines matter more: 97% of those who researched the attorney they contacted used one.
Is it true that 96% of people seeking legal advice use a search engine?
Only of people already looking online. The figure comes from a 2014 Google and FindLaw infographic, where it reads '96% of people seeking legal advice use a search engine when looking online', from a November 2013 Google survey. FindLaw's own 2014 survey found 38% of adults would use the internet to find a lawyer.
Do lawyers have to file video ads with the state bar?
In some states. Florida requires non-exempt ads to be filed at least 20 days before first use, with a $250 fee from July 1, 2026. Texas requires filing no later than ten (10) days after first use, with a $100 fee, and Louisiana charges $175. New York does not require filing but makes lawyers keep copies for three years.
Where does 'video marketers grow revenue 49% faster' come from?
From a 2015 Aberdeen Group survey of 168 companies in general, not law firms. Companies using video in their marketing reported 13.3% revenue growth against 8.9% for the others, and 13.3 divided by 8.9 is 1.49, which is where '49% faster' comes from. It shows correlation in self-reported data, not an effect of video.
How many lawyers are there in the United States?
The ABA counted 1,377,600 resident active lawyers in 2025. BLS counted about 863,700 lawyer jobs in 2025 including the self-employed, and an annual mean wage of $185,840 for lawyers on a payroll.