On August 24, 2026, YouTube began counting a view the moment any video starts to play. What did that do to likes and comments per view? We compared the biggest channels' videos posted before the change with their videos posted after it, with Shorts, already counted that way, as the check.
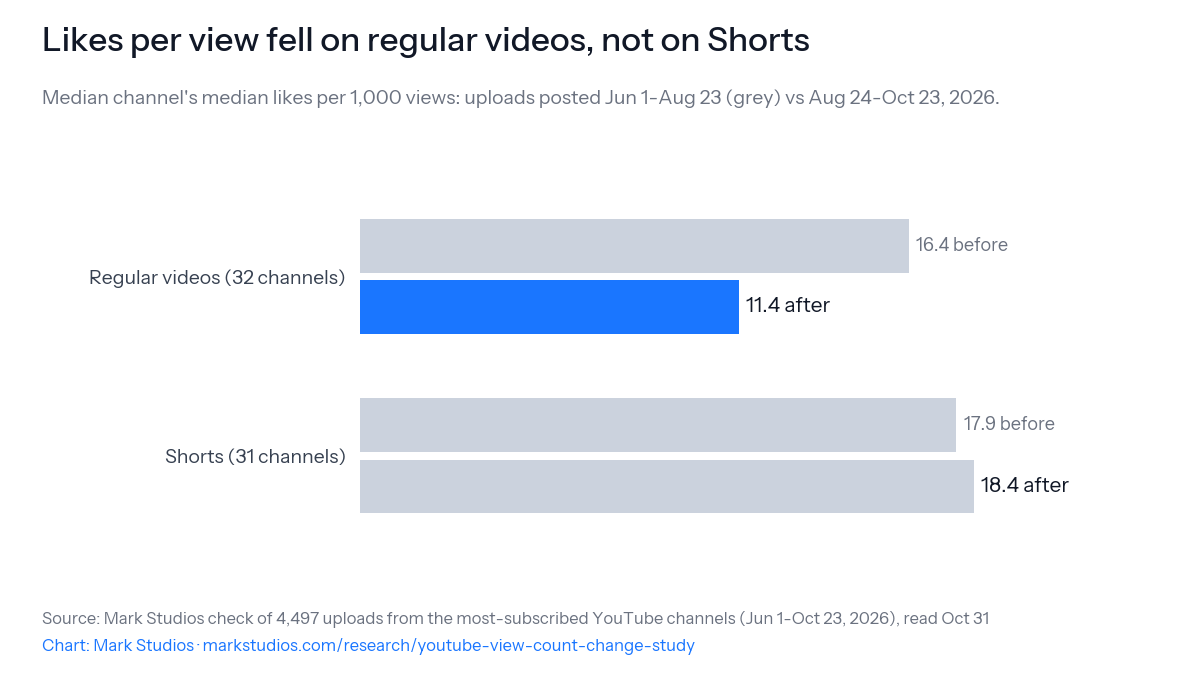
Since August 24, 2026, when YouTube began counting a view the moment any video starts to play, likes per view on the biggest channels' regular videos have fallen by 26%: the median channel went from 16.4 likes per 1,000 views on videos posted June 1 to August 23 to 11.4 on videos posted after. See details
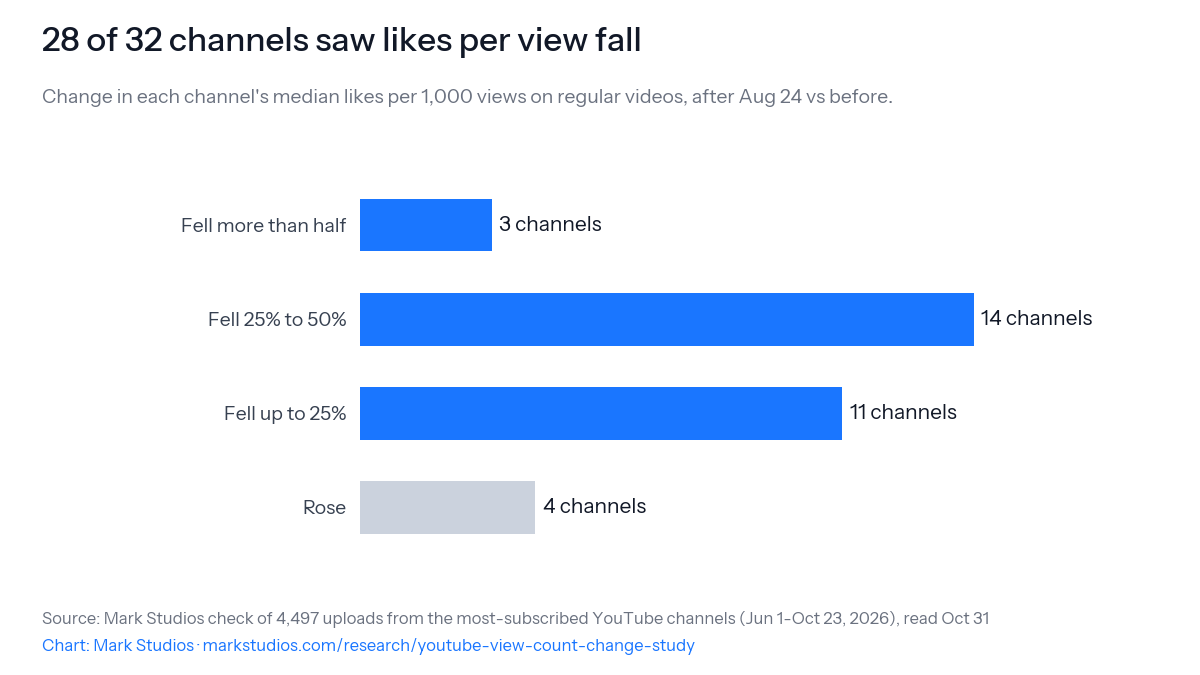
28 of the 32 channels with enough videos on both sides saw the rate fall, 25 by more than 10%. See details
Shorts, which YouTube has counted from the first play since March 31, 2025, moved 2% down over the same dates, so the change, not the season or the audience, explains the drop on regular videos. See details
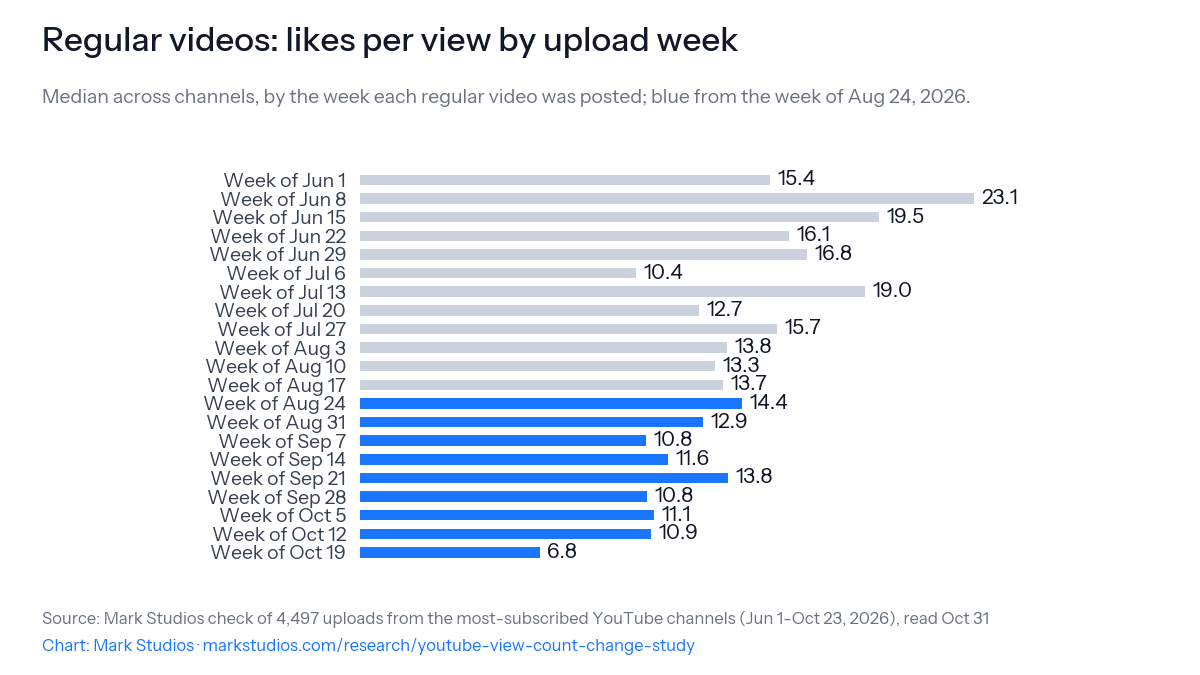
The effect builds in by upload date: regular videos posted after August 24 drew 27% fewer likes per view than the same channels' June and July videos, but only 14% fewer than their videos from the four weeks just before the change, which collected part of their views under the new count. See details
Comments per view on regular videos fell 21% at the median channel. See details
Engagement rates, cost-per-view prices and view-based benchmarks from before August 24, 2026 are not comparable with numbers measured on newer videos. See details
What changed on August 24, 2026?
YouTube began counting a view the moment a video starts to play, autoplay included, across Shorts, long-form videos and live streams (YouTube Help). Shorts had already counted views that way since March 31, 2025 (YouTube Help), so the change mainly affected regular videos. YouTube says Partner Program earnings are still based on "engaged views". The public view count, the one in the API and under every video, is the new one, and it is what engagement rates, cost-per-view prices and most benchmarks divide by.
How much did likes per view fall?
We read every upload that the most-subscribed YouTube channels posted from June 1 to October 23, 2026 and compared each channel with itself: its videos posted before August 24 against its videos posted after. The median channel's regular videos drew 16.4 likes per 1,000 views before the change and 11.4 after, and the typical channel's own ratio fell by 26% (the middle half of channels fell between 12% and 35%).
Likes per view fell on regular videos, not on ShortsMedian channel's median likes per 1,000 views: uploads posted Jun 1-Aug 23 (grey) vs Aug 24-Oct 23, 2026.Use this chart on your site
Gradually, by upload date, rather than in a single week. A video collects most of its views in its first weeks, so videos posted in the weeks just before August 24 had part of their views counted the new way. Grouping regular videos by the week they were posted, the median channel's rate ran between 10.4 and 23.1 likes per 1,000 views in the weeks before the change and between 6.8 and 13.8 after it.
Regular videos: likes per view by upload weekMedian across channels, by the week each regular video was posted; blue from the week of Aug 24, 2026.Use this chart on your site
Splitting the earlier videos shows it: regular videos posted after August 24 drew 27% fewer likes per view than the same channels' videos from June and July (26 of 29 channels down), but only 14% fewer than their videos from the four weeks just before the change (15 of 22).
Did the same thing happen to Shorts?
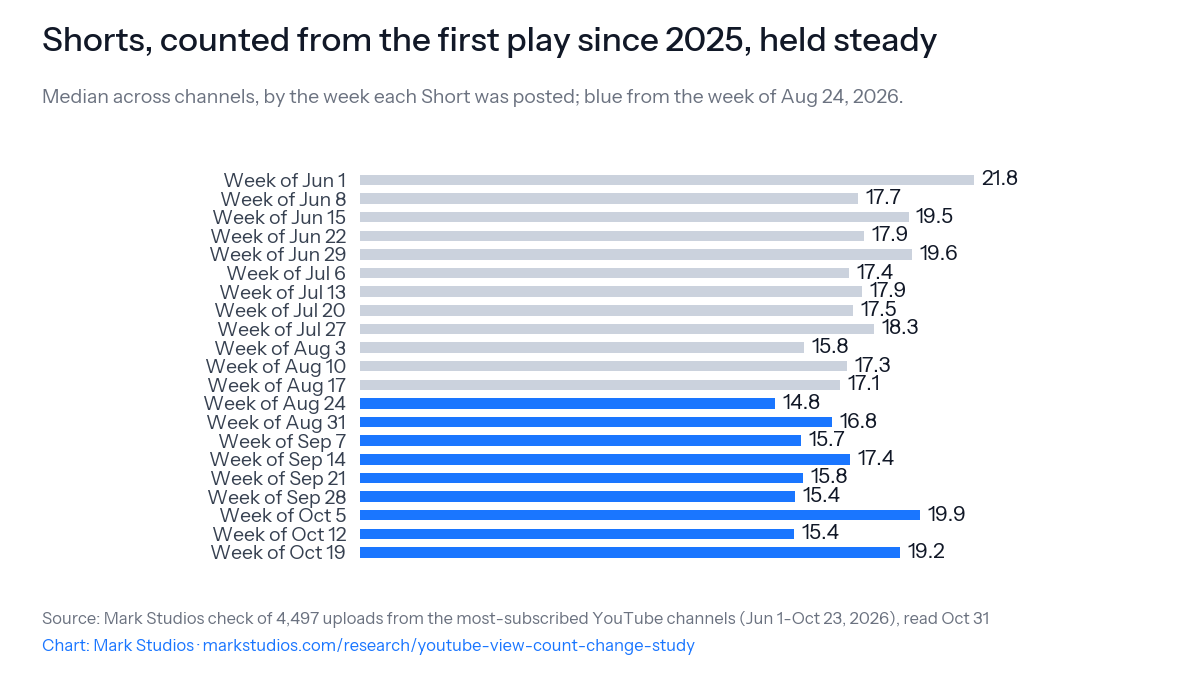
No, which is what points at the counting change. Shorts on the same channels drew 17.9 likes per 1,000 views before August 24 and 18.4 after; the median channel's own ratio was 2% lower. YouTube had counted Shorts views from the first play since March 2025, so August 24 changed nothing for them. Season, audience and channel changes would have moved Shorts too.
Shorts, counted from the first play since 2025, held steadyMedian across channels, by the week each Short was posted; blue from the week of Aug 24, 2026.Use this chart on your site
Not in a way this comparison can show. The median channel's regular videos posted after August 24 drew about as many views each as its videos from June to August, though the newer videos had had weeks, not months, to collect them. On the same channels, newer Shorts drew 38% fewer views than older ones, which is what age alone does to a view count. Likes per view, a ratio, is less sensitive to age, which is why this study measures it.
What about comments?
Comments per view fell on regular videos as well, by 21% for the median channel (25 of 31 channels down). Likes and comments come from people who watched; the new count adds plays that end before anyone could react.
Which channels changed the most?
The fall was broad. 28 of 32 channels with at least 3 qualifying regular videos on each side saw likes per view fall. On the 20 channels with enough regular videos and Shorts on both sides, regular videos fell more than Shorts on 15.
28 of 32 channels saw likes per view fallChange in each channel's median likes per 1,000 views on regular videos, after Aug 24 vs before.Use this chart on your site
What this means for creators, brands and benchmarks
Old benchmarks no longer apply. An engagement rate or like-to-view ratio from before August 24, 2026 was measured against fewer, longer-watched views. Our engagement rate study measures newer uploads only.
Cost per view got cheaper on paper. A sponsorship priced per view now pays for plays that may last a second; check how a deal defines a view.
Compare like with like. Judge a video posted after the change against other videos posted after it, and Shorts with Shorts.
Likes and comments are the steadier signal. They count people who reacted, which the change left alone.
Channels. The most-subscribed YouTube channels in Wikipedia's list as listed on October 25, 2026 (68 read). The 32 channels that post more than 14 uploads a week were left out, since their upload lists run to dozens of pages; most are TV networks and music labels.
Uploads. On October 31, 2026 we listed each channel's uploads back to June 1, 2026 through the YouTube Data API, classed each as a Short or live stream when YouTube lists it in the channel's Shorts or live playlist, and read its views, likes, comments and audience setting (videos.list). An upload counts when it was posted from June 1 to October 23, 2026, was at least 7 days old when read, had at least 1,000 views and public counts, and was not set as made for kids: 4,497 did.
Comparison. For each channel and type, the median likes (and comments) per 1,000 views of uploads posted before August 24 and of those posted on or after it; a channel needs at least 3 on each side. The change is the after median over the before median; we report the median across channels.
Limitations
Not an experiment. Other things changed between June and October: seasons, trends, what each channel posted. Shorts on the same channels, unaffected by the change, are the check against that.
Older videos had longer to collect views and likes. Videos were read once, so June videos were months older than October ones. Shorts on the same channels, read at the same ages, show no matching fall.
The biggest channels only. Smaller channels with more autoplay traffic, or less, may have changed by different amounts.
Old uploads keep their old counts. Views a June video collected before August 24 were counted the old way; views after it, the new way.
Our measurements and the CSVs are free to reuse under CC BY 4.0 with a link to this page. The videos remain the property of the channels that published them.
We plan to rerun the comparison as more post-change uploads age. Corrections go to contact@markstudios.com.
October 31, 2026: First published.
Frequently asked questions
Did YouTube change how views are counted in 2026?
Yes. Beginning August 24, 2026, YouTube counts a view the moment a video starts to play, across Shorts, long-form videos and live streams, according to its help page on how engagement metrics are counted. Shorts had counted views that way since March 31, 2025. YouTube says Partner Program earnings are still based on engaged views.
Did YouTube engagement drop after the view count change?
Per view, yes. On the biggest channels, regular videos posted after August 24, 2026 drew 26% fewer likes per 1,000 views than the same channels' videos from June to August, at the median channel, while Shorts, already counted from the first play, changed by about 2%. The new count adds plays that end before anyone could react, so the same reactions sit on more views.
Why do my YouTube videos get fewer likes per view since late August 2026?
Mostly because of how views are counted. Since August 24, 2026, YouTube counts a view the moment a video starts to play, autoplay included, so short plays that ended before anyone could react now count. On the biggest channels, regular videos posted after the change drew 26% fewer likes per view than the same channels' earlier videos, while their Shorts, already counted that way, barely moved.
Can I compare engagement rates from before and after August 24, 2026?
Not directly. A rate measured on videos posted after the change divides the same likes and comments by more views, so it comes out lower. Compare new uploads with other new uploads, and treat 2025 and early-2026 benchmarks as a different measure.
Can I use this data?
Yes. Our measurements and the per-upload and per-channel CSVs are free to reuse under CC BY 4.0 with a link to this page. The videos belong to the channels that published them; we publish only their public counts and links.