Every figure on this page links to the organization that produced it, and each was re-checked against that source before publishing. How long videos run on the biggest YouTube channels and whether length tracks views, what each platform counts as a view, how much of a video people watch at each length, how fast viewers decide to stay, what slow playback costs, how viewing is moving between Shorts, long-form and the TV, and where the popular attention-span and video-length rules came from.
The biggest YouTube channels' latest long-form videos ran a median of 12.3 minutes, but 35% ran under five minutes and 38% ran 20 minutes or longer. (Our YouTube video length study)See details
Within those channels, longer videos had only slightly more views: a median rank correlation of 0.11, positive in 58 of 96 channels. (Our calculation)See details
There is little sign the biggest channels aim for YouTube's 8-minute mid-roll line: 74 videos ran 8:00 to 8:59, but 23 came from one channel; without it, 51 against 42 a minute shorter. (Our calculation)See details
Since August 24, 2026, YouTube counts a view from the first frame on every format; the old definition is now an 'engaged view'. (YouTube)See details
Ad views count after 2 seconds under the industry standard, 15 seconds for a Meta ThruPlay, and 30 seconds for a paid YouTube view. (Media Rating Council; Meta; Google)See details
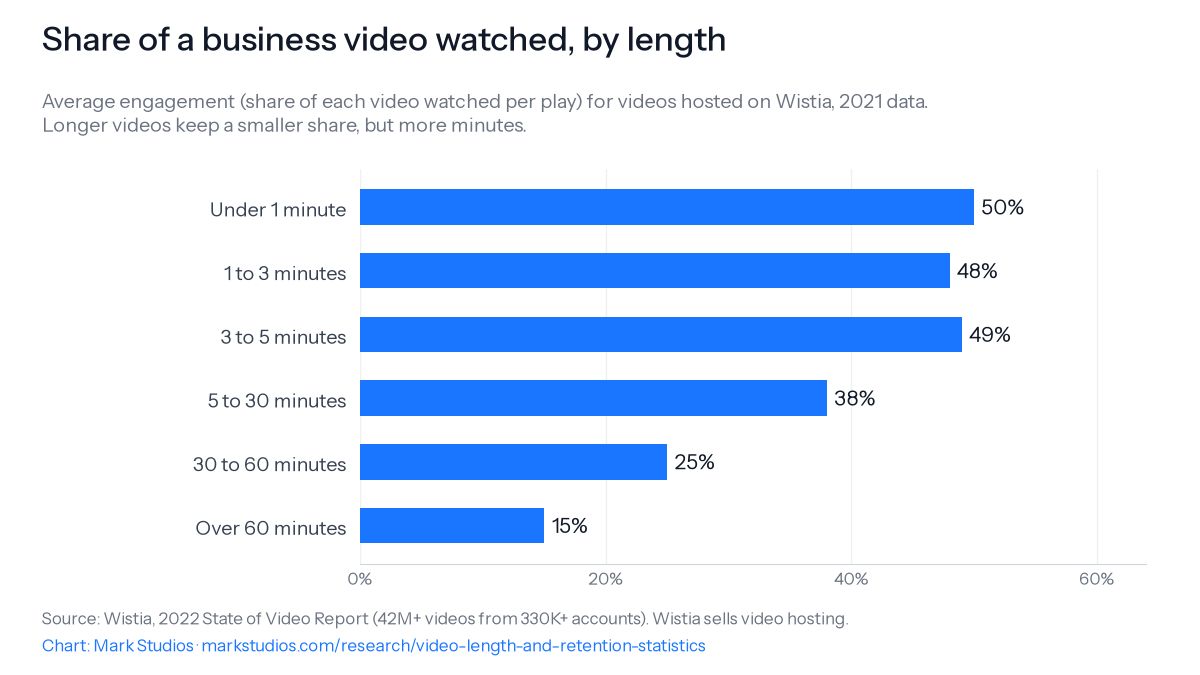
Business videos under a minute were watched 50% of the way through on average in Wistia's 2021 data, and videos over an hour 15%. (Wistia)See details
A smaller share of a longer video is still more watching: at 25% engagement, a 30-to-60-minute video holds a viewer for about 7.5 to 15 minutes. (Wistia; our calculation)See details
Viewers start abandoning a video that takes more than 2 seconds to start, and each extra second raised abandonment by about 5.8% in Akamai's data. (Krishnan and Sitaraman, 2012)See details
YouTube took 15.8% of U.S. TV-set viewing in August 2026, up 2.7 points in a year: long-form viewing is moving to the TV. (Nielsen; our calculation)See details
The '8-second attention span' was on Statistic Brain by February 2012 labelled 2012, was relabelled 2013 in January 2014, and no study behind it has been found. (Statistic Brain, via the Internet Archive)See details
Facebook's '47% of value in the first three seconds' measured how much value came from people who watched under three seconds, not which seconds of the ad carried it. (Facebook and Nielsen, 2015)See details
Wistia's 2016 '2-minute sweet spot' came with a second sweet spot at 6 to 12 minutes that most lists leave out. (Wistia)See details
How long are YouTube videos in 2026?
On the biggest channels, a median of 12.3 minutes. For our YouTube video length study we read the 30 latest long-form uploads of each of the 97 most-subscribed YouTube channels on October 26, 2026, 2,859 videos in all. The lengths do not gather around that median: 35% of the videos ran under five minutes and 38% ran 20 minutes or longer, with fewer in between (our calculation from the study's public dataset). Music channels hold the short end and gaming, education and compilation channels the long end, so an "average video length" describes few real videos.
Pew Research Center's count of every video posted in the first week of 2019 by channels with at least 250,000 subscribers, 243,254 videos, gave an average of 12 minutes, with 3% running past an hour (Pew Research Center). English-language gaming videos averaged 24 minutes (median 13) against 11 minutes (median 5) for everything else, and the median gaming video drew nearly three times the first-week views of other videos (Pew Research Center). Business video runs long as well: the average video made on Vidyard, a business video platform, in 2022 lasted 15 minutes and 31 seconds across more than 1.7 million videos, up from 9:58 a year earlier (Vidyard, 2023 benchmark report, Internet Archive capture).
What counts as a view, and how long can a video be, on each platform?
Anything from the first frame to 30 seconds of watching, depending on who is counting. Since August 24, 2026, YouTube counts a view the moment a video starts to play, on Shorts, long-form videos and live streams alike (YouTube Help). The old definition is now called an "engaged view": clicking to watch, or watching past the initial seconds, which YouTube does not define in seconds; earnings and the retention metrics in YouTube Studio still use engaged views (YouTube Official Blog). Shorts switched first: YouTube's help page says that starting 3/31/2025, a Shorts view counts every start or replay, with no minimum watch time (YouTube Help). View counts from before and after those dates measure different things.
What each platform counts as a view, and its length limits, as published on its own help, ad-spec or news pages (read October 28, 2026).
Platform
When a view counts
Longest video
Short-form and other limits
YouTube
From the first frame, all formats, since August 24, 2026
15 minutes by default; 12 hours for verified accounts (YouTube Help)
Shorts up to 3 minutes since October 15, 2024 (YouTube Official Blog); mid-roll ads only on videos of 8 minutes or longer (YouTube Help)
YouTube ads (Google)
Skippable after 5 seconds; the advertiser pays for a view at 30 seconds, or the whole ad if shorter, or an interaction (Google Ads Help; Google Ads Help)
Non-skippable in-stream ads 60 seconds or shorter (Google Ads Help)
Retention inside YouTube Studio is measured from engaged views. Its "Intro" figure is the share of viewers still watching after the first 30 seconds (YouTube Help), and its "typical retention" line compares a video with the channel's 10 latest videos of similar length (YouTube Help). The 30 seconds that people often quote as "what YouTube counts as a view" is the advertising rule above, not a rule YouTube ever published for ordinary views.
How much of the biggest YouTube channels' long-form output would fit each limit. Share of the 2,859 latest long-form videos of the 97 most-subscribed channels at or under each length (our calculation from the YouTube video length study's dataset, October 26, 2026).
About half of a short video, and a smaller share of a long one. Wistia, which sells video hosting to businesses, measures "engagement" as the average share of a video watched per play. In its 2022 report, which drew on more than 42 million videos uploaded by over 330,000 accounts from 2019 to 2021, videos under a minute averaged 50% in 2021, and videos over an hour 15% (Wistia, 2022 State of Video Report, Internet Archive capture). Wistia's 2026 report, on more than 13 million videos, put the under-a-minute figure at 52% (Wistia). Vidyard counts something different: the share of viewers who reach the end. In its 2025 report on more than 940,000 videos made in 2024, 65% of viewers finished videos under a minute and 20% finished videos over 20 minutes (Vidyard). Both samples are business and sales video, not social feeds.
Share of a business video watched, by length. Wistia: average share of the video watched per play. Vidyard: share of viewers who finish. Different metrics, so compare the slope, not the levels.
Share of a business video watched, by lengthAverage share of each video watched per play, for business videos hosted on Wistia in 2021, by length. Source: Wistia, 2022 State of Video Report. Wistia sells video hosting; its customers' videos are marketing, sales and training video.Use this chart on your site
A smaller share of a longer video is still more watching. At Wistia's 2021 averages, a viewer of a one-to-three-minute video watches about 29-86 seconds, and a viewer of a 30-to-60-minute video about 7.5-15 minutes (our calculation: the share watched times the shortest and longest length in each band). Wistia makes the same point with its 2023 data: a 30-to-60-minute video had about half the engagement rate of a one-to-three-minute video but over 10 times the total watch time (Wistia). How-to content holds attention best: in that edition, three-to-five-minute videos averaged 43%, against 74% for instructional videos of that length (Wistia).
Short social video is watched for seconds whatever its length. In Buffer's analysis of 1.1 million TikToks, the median watch time was 3.1 seconds for videos of 5 to 10 seconds and 11.3 seconds for videos of one to ten minutes, the most of any length (Buffer). Buffer sells social media scheduling and does not say how the TikToks were sampled or over what period. The longest band wins on seconds watched, but 11.3 seconds is at most 19% of even a one-minute video (our calculation).
Do longer videos get more views?
Barely, on the biggest YouTube channels. Within each of 96 of the most-subscribed channels in our length study, we ranked its latest long-form videos by length and by views: the median rank correlation was 0.11, where 1 would mean the longer video always had more views and 0 no relationship at all. Longer videos had more views on balance in 58 of the 96 channels, and the link was moderate or stronger (0.3 or more) in only 26. Older videos have had longer to collect views, so we also controlled for each video's place in the upload order; the median correlation was 0.12 (our calculation from the study's public dataset). The 158 videos YouTube listed without a view count are left out, which leaves one channel with too few to compare. The view counts were read on October 26, 2026, after YouTube began counting a view from the first frame.
On short-form platforms the brand accounts Socialinsider tracks show no single rule. In its study of 8 million brand TikTok videos from January to June 2026, videos of two to three minutes averaged 12,000 views against 1,200 for videos under 30 seconds, 10 times as many (our calculation). Among 9.8 million brand Instagram Reels, views peaked at 45 to 60 seconds, with 10,374 on average, and Reels over three minutes averaged 4,428, fewer than Reels under 30 seconds (Socialinsider). Socialinsider sells social media analytics; its averages cover brand accounts with 1,000 to 1 million followers, and averages are pulled up by a few large hits.
YouTube's recommendations lean long. In Pew's 2018 study of more than 170,000 automated "random walks" through YouTube's recommendations, the randomly chosen starting videos averaged 9 minutes and 31 seconds; by the fifth recommendation, videos averaged nearly 15 minutes (Pew Research Center).
Do creators cut videos to just over 8 minutes for mid-roll ads?
Not on the biggest channels. YouTube lets creators place ads in the middle of a monetized video only when it runs 8 minutes or longer (see the platform table above), and 58% of the biggest channels' latest long-form videos clear that bar. If channels aimed for it, videos would bunch just above 8 minutes. The 8:00 to 8:59 band does hold 74 videos against 42 a minute shorter, but 23 of the 74 come from one channel; without it the band holds 51, close to its neighbours (our calculation from the length study's public dataset). The threshold was 10 minutes until 2020, which is where the advice to make "10-minute videos" comes from (see below).
How fast do viewers decide whether to keep watching?
In feeds, within a couple of seconds. Facebook reported in April 2016 that people spent an average of 1.7 seconds with a piece of News Feed content on mobile and 2.5 seconds on desktop, and that in tests by Fors Marsh Group people could recall mobile feed content after only 0.25 seconds (Facebook IQ, Internet Archive capture). That is time spent with any post, video or not, not an attention span. Facebook also said people scroll mobile News Feed 41% faster than desktop (Facebook for Business, 2017, Internet Archive capture).
Viewers who get past the opening tend to stay a while. Facebook said in February 2016 that 65% of people who watch the first three seconds of a Facebook video watch at least ten, and 45% keep watching for thirty (Facebook for Business, Internet Archive capture). In TikTok's ad data from 2020, over 63% of the auction ads with the highest click-through rates showed their key message or product within the first three seconds (TikTok for Business). A lab study TikTok commissioned from MediaScience in 2021, with 343 U.S. adults aged 18 to 45, found an ad on screen for six seconds or less still delivered 38% of the brand recall of ads seen for 20 seconds or more (TikTok for Business).
Early branding helps recall but can invite the skip. Google's YouTube team coded thousands of skippable ads from 16 countries on 170 creative attributes in 2015 and found that showing the brand in the first five seconds raised ad recall and awareness but also made people more likely to skip (Think with Google). In a 2017 Google test of three cuts of one Maruti Suzuki ad in India, early branding did not cost views: all three cuts had similar view-through rates, 30% for the cut with a logo watermark in the first five seconds, 29% for the other early-branding cut and 27% for the original, and the two early-branding cuts drove the strongest product consideration lifts (Think with Google). Google said in 2017 that over 9 in 10 of its six-second bumper campaigns lifted ad recall (Google blog), and it now says ads that follow its ABCD guidelines, which include hooking attention early, can deliver up to a 30% lift in short-term sales likelihood, citing a 2021 study with Kantar (Google Ads Help, Internet Archive capture).
Snap's commissioned research points the same way. A 2025 MAGNA study of more than 4,800 Snapchatters in five markets found the first 2 seconds of an ad are key to recall (Snap), and a 2025 Lumen study in India found gains in attention diminish after about 9 seconds (Snap). All of these figures come from platforms or their paid partners describing their own ad products, mostly without published samples.
How quickly do viewers abandon a slow or stalling video?
After about two seconds. In Akamai data on 23 million on-demand video views by 6.7 million viewers over ten days, S. Shunmuga Krishnan and Ramesh Sitaraman found that viewers began to abandon a video once it took more than 2 seconds to start, and that each extra second of delay raised the abandonment rate by about 5.8% over the range they fitted (Krishnan and Sitaraman, ACM Internet Measurement Conference 2012). The median view in that data lasted 35.4 seconds, which the authors put down to viewers sampling videos before settling on one. Viewers of short videos (median 1.8 minutes) were less patient than viewers of long ones, giving up sooner in 11.5% more matched pairs than the reverse, and viewers on fiber were less patient than viewers on mobile, by a margin of 38.25% of matched pairs.
Stalls cost watching time and return visits. A viewer whose stalls added up to at least 1% of a video's length watched 5.02% less of it than a matched viewer with none, and a visit that ended in a playback failure made viewers 2.32% less likely to return within a week, a net margin across matched pairs rather than a drop in the return rate. A study of Conviva data from fall 2010 found that a 1% rise in buffering time cut viewing of a 90-minute live event by more than 3 minutes, and that cutting buffering by 1% added 2.4 minutes of live viewing per viewer per week (Dobrian et al., ACM SIGCOMM 2011). Researchers from Akamai and Conviva co-wrote these papers using their companies' data.
Plays abandoned before the first frame are common. Conviva, which sells streaming analytics, counted 11.5% of attempted plays in its customers' apps ending before the video started in the first quarter of 2018, across 14.5 billion plays, and 12.7% in the second quarter (Conviva, Q1 2018; Conviva, Q2 2018). Those counts include every reason to leave, not only waiting. Starts were still slow in 2022: Conviva's global average video start time was 4.62 seconds in the second quarter, with 0.22% of viewing time spent buffering (Conviva, State of Streaming Q2 2022). NPAW, another streaming analytics firm, reported on-demand start times 14% faster in 2025 than in 2024 across more than 200 streaming services (NPAW).
Is long-form viewing shrinking?
No. It is moving to the television. YouTube was 15.8% of all U.S. TV-set viewing time in August 2026, a record for any platform in Nielsen's monthly Gauge, up from 13.1% in August 2025, a rise of 2.7 points in a year (our calculation) (Nielsen, The Gauge, August 2026; Nielsen, August 2025). Streaming as a whole reached 49.6% of TV-set time, against 26% when Nielsen launched The Gauge in June 2021 (Nielsen). The Gauge counts only viewing on a television screen, and Nielsen has announced a one-time change to its method from the September 2026 data, so later months will not compare cleanly with August. YouTube said in early 2025 that viewers watch more than 1 billion hours of YouTube on TV screens a day and that TV had overtaken mobile as its main screen in the U.S., by watch time (YouTube). Podcasts are part of it: Alphabet said more than 700 million hours of YouTube podcasts were watched on living-room devices in October 2025, up 75% on a year earlier (Alphabet, Q4 2025 earnings call).
Short-form counts are not comparable with long-form ones. YouTube Shorts averaged 200 billion daily views as of January 2026, according to YouTube's chief executive (YouTube), but since March 2025 a Shorts view counts every time a Short starts or replays. Netflix sits at the opposite end: it counts a "view" as hours watched divided by a title's runtime, and its members watched 96B hours in the second half of 2025 (Netflix, What We Watched) and more than 97B in the first half of 2026 (Netflix).
Time with traditional TV is falling, fastest among the young. Americans 15 and over spent 2.6 hours a day watching TV in 2025, against 2.8 in 2015; 15-to-19-year-olds spent 1.48 hours and people 75 and over 4.43 (BLS, American Time Use Survey). In the UK, 16-to-24-year-olds watched 17 minutes of live broadcast TV a day in 2024 (Ofcom, Media Nations 2025), while 15-to-17-year-olds spent 1 hour 46 minutes a day on YouTube and 50 minutes on TikTok in May 2025 (Ofcom, Online Nation 2025). UK adults averaged 51 minutes a day on YouTube on phones, tablets and computers, not counting the TV set, and TikTok users 28 minutes on TikTok (Ofcom).
In the U.S., 84% of adults said in 2025 that they use YouTube and 37% TikTok (Pew Research Center). Among teens, 76% used YouTube daily in fall 2025 and 21% said they were on TikTok "almost constantly" (Pew Research Center).
What does research on attention spans actually measure?
Not a single number of seconds. The closest measurements count how long people stay on one screen before switching. Gloria Mark of the University of California, Irvine, with colleagues at Microsoft Research and MIT, logged the work computers of 40 information workers at a large U.S. technology company for about 12 working days: they stayed on one screen for a mean of 47.0 seconds before switching, with a median of about 40 seconds (Mark et al., CHI 2016). Her earlier studies found about three minutes per task when observers shadowed 14 workers at one company (González and Mark, CHI 2004) and 75.5 seconds per window when software logged 13 workers in 2012 (Mark et al., CHI 2012). In a 2023 interview she put the 2004 figure at two and a half minutes (American Psychological Association, Internet Archive capture), a little under the paper's own wording. These studies count window switches at work in small groups, not how long anyone can follow a video.
Research on public attention measures something else again. Lorenz-Spreen, Mønsted, Hövel and Lehmann found that a hashtag stayed in Twitter's global top 50 for 17.5 hours on average in 2013 and 11.9 hours in 2016 (Nature Communications, 2019), a measure of how fast topics turn over. The Technical University of Denmark's release on the 17.5-to-11.9-hour finding quotes co-author Sune Lehmann that the study "does not address attention span on the level of the individual person" (DTU, Internet Archive capture).
What the popular video length and attention numbers really say
Advice on video length leans on a handful of numbers that began as something narrower: one company's customer data, a lecture-hall study from the 1970s, an upload cap, an ad-measurement footnote. We traced the most repeated to the earliest document we could read. Pages that repeat a claim are linked only as dated evidence of how it changed, never as a source for the number.
"The human attention span is 8 seconds, shorter than a goldfish's"
The number came from a statistics website with no study behind it, three years before Microsoft repeated it. The earliest Internet Archive capture of Statistic Brain's "Attention Span Statistics" page, from February 8, 2012, printed an average attention span of 8 seconds labelled "2012", 12 seconds for 2000 and 9 seconds for "a gold fish", crediting only The Associated Press and giving no study, population or method (Statistic Brain, February 2012 capture). The only study the page named sat under a separate block of web-browsing figures, such as 17% of page views lasting under four seconds. That study, by Weinreich, Obendorf, Herder and Mayer, logged the browsers of 25 volunteers in winter 2004-05; over 17% of first visits to a page lasted under four seconds and the median lasted 12.4 seconds, and the paper has no attention-span figure (ACM Transactions on the Web, 2008). The page's wording follows Jakob Nielsen's 2008 re-analysis of the same data, which set aside the 17% of page views under four seconds as bounces (Nielsen Norman Group). Its "average length watched of a single internet video", 2.7 minutes, matches the average online video duration Comscore reported for July 2007, 2.7 minutes (Comscore), though Statistic Brain never names Comscore.
Between the captures of December 31, 2013 and January 3, 2014, the page relabelled the same 8 seconds as "2013" and added the National Center for Biotechnology Information and the U.S. National Library of Medicine to its sources (Statistic Brain, January 2014 capture). By May 4, 2015 it showed 8.25 seconds for "2015" (Statistic Brain, May 2015 capture). Marketers had picked up the figure long before Microsoft did: in April 2013 a web-marketing agency, Bluetent, told clients that "a study from 2012" gave a website an average of 8 seconds to impress a visitor (Bluetent).
Microsoft Canada's spring 2015 "Attention spans" report reprinted the "2013" version on page 6 as a graphic: 12 seconds in 2000, 8 seconds in 2013 and 9 for a goldfish, credited "Source: Statistic brain". Microsoft's own research for the report was an online survey of 2,000 Canadians in late 2014 and a portable-EEG study of 112 people, and neither produced a figure in seconds. Its survey cuts against the usual reading about young people: 31% of 18-to-34-year-olds scored in the top third for sustained attention, against 35% of those over 55, and the report says age "isn't significantly tied to sustained attention" (Microsoft Canada, Internet Archive capture). Time spread the claim on May 14, 2015 as "a new study from Microsoft Corp." (Time), and a year later a Guardian column still described a world where the attention span "has fallen to eight seconds, shorter than a goldfish" (The Guardian).
The BBC's More or Less followed the figure through Time, the Telegraph, the Guardian, USA Today, the New York Times and the National Post back to the 2015 Microsoft Canada report, then to Statistic Brain, and found that neither the National Library of Medicine nor the Associated Press had any record of the research (BBC News, March 2017). In a 2016 review the physiologist Neil Bradbury noted that the study "discussed in Time magazine" put the average attention span at only 8 s and argued it was premature to build teaching on it (Advances in Physiology Education, Internet Archive capture). His own explanation, that the 8-second figure reflects the time a person spends on a web page, comes with no citation, and the one web-use study on Statistic Brain's page reports median page stays of 9.4 to 12.4 seconds, so do not repeat that either. As for the fish, Bradbury quoted the claim that goldfish "have an attention span of 9 s" and pointed out that no one knows how to measure a goldfish's attention span; what has been measured is goldfish memory. In a University of Plymouth experiment, goldfish learned to press a lever for food that worked one hour a day and kept to that schedule over 4 weeks (Gee, Stephenson and Wright, Journal of the Experimental Analysis of Behavior, 1994, via Europe PMC), and a 1970 study in Science tested goldfish on learned colours after 1 day and 2 weeks (Behrend, Powers and Bitterman, Science, via Europe PMC). No study we could find measured a human attention span of eight seconds, or a goldfish's of nine. What to use instead: if a number is needed, use one that says what it measured, such as Gloria Mark's 47 seconds on one screen at work (above), with its scope.
Our online course video statistics page summarizes the same trace. One detail is added here: before January 2014 Statistic Brain credited the Associated Press alone and labelled the 8 seconds "2012".
"Gen Z has an 8-second attention span"
This is the same unsourced number with a generation attached, and Microsoft's own data contradict it. The earliest version we found is sparks & honey's "Meet Generation Z" deck, uploaded on June 17, 2014, which prints "8 sec" as "the average American attention span (down from 12 sec in 2000)" under the heading that young people's attention spans are getting shorter, crediting the same sources Statistic Brain had listed since January 2014 (sparks & honey, via SlideShare). The first explicit claim that the generation itself has an eight-second span that we found is a December 2014 Campaign US story, first run in PRWeek, reporting that a UK mobile marketing company, Global Messaging, had found it; we found no method, sample or report behind it (Campaign US). Microsoft Canada's survey found no significant link between age and sustained attention (see the trace above). What to use instead: nothing; no study has measured a generation's attention span in seconds.
"Keep your videos under two minutes"
This is Wistia's own customer data, and Wistia never said every video should be that short. The earliest Wistia data behind it is a December 2009 post on "the thousands of videos we host": the average 30-second video was watched 85% of the way through and the average two-minute video 50% (Wistia blog, December 2009, Internet Archive capture). The same post said the share watched held roughly steady from two-minute to 10-minute videos, and its advice was to keep videos of 2 minutes and under short and punchy, while taking the time a complex message needs. It gave no sample size or date range. Wistia's May 2012 update found no major difference between a 4-minute and a 10-minute video (Wistia blog, May 2012, Internet Archive capture). The version most lists cite is Wistia's July 2016 study of 564,710 videos, which called 2 minutes "the sweet spot" and also named 6 to 12 minutes a second sweet spot, with hardly any drop in that range (Wistia blog, July 2016, Internet Archive capture). The measure in every edition is the share of a video watched, which almost has to fall as videos get longer even while minutes watched rise (see above). Wistia sells video hosting, and its customers' videos are business and marketing video. A related Wistia line from December 2009, that keeping a title screen up for even five seconds can cause 20% of an audience to leave, came with no data at all (Wistia blog, Internet Archive capture). What to use instead: the share-watched and finish-rate table above, with its metric named.
"The optimal video length is six minutes"
This comes from four free online courses in 2012, and the rule was older than the data. Philip Guo's November 2013 post on the edX blog said the optimal course video is 6 minutes or shorter, judged by how long students kept watching rather than what they learned (edX blog, Internet Archive capture). The peer-reviewed paper by Guo, Kim and Rubin found median engagement of at most 6 minutes per session whatever a video's length, across 6.9 million sessions in four fall 2012 edX courses, and records that edX producers had already been telling instructors to cut lessons into chunks under 6 minutes "based solely upon their prior intuitions" (Guo, Kim and Rubin, Learning@Scale 2014). Teaching guides then repeated it: Brame's widely used 2016 guide recommends videos of 6 minutes or less, citing Guo rather than new data (CBE—Life Sciences Education). Students in a degree course behaved differently. In 13,107 sessions with 28 Stanford computer science lectures averaging 50.1 minutes, the median session lasted 12.1 minutes, and once each student's sessions were joined up, the typical student watched 91.3% of each video over several sittings; the authors put a rule-of-thumb maximum at 12-20 minutes (Lagerstrom, Johanes and Ponsukcharoen, ASEE 2015, Internet Archive capture). The full trace of the edX finding is on our online course video statistics page. What to use instead: "in four 2012 MOOCs, median watching time per session was at most six minutes", with that scope.
"Attention drops after 10 minutes"
This is a lecture-hall claim from the 1970s, and later reviews found little behind it. Bradbury's 2016 review notes that several institutions cut lectures to 15 minutes on the "common knowledge" that attention fades 10 to 15 minutes in, and traces that belief to a single 1978 review by Hartley and Davies that was about note taking, not attention (Bradbury, Advances in Physiology Education, Internet Archive capture). The observation studies behind it are thin: Johnstone and Percival (1976) reported attention lapses in the first five minutes and again 10-18 minutes into chemistry lectures, judged by observers watching students, and in Stuart and Rutherford's 1978 study medical students' self-rated attention rose for the first 10-20 minutes and then declined slowly without falling below its starting level (both as summarized by Bradbury). Wilson and Korn's 2007 review found little support for a decline after 10 to 15 minutes (Teaching of Psychology, via ERIC), and a 2010 clicker study of three chemistry courses found students reported lapses of 1 minute or less more often than longer ones, from early in the class (Journal of Chemical Education, via ERIC). None of these studies looked at video. What to use instead: no fixed limit; attention in a lecture comes and goes in short lapses, and the teacher matters more than the clock.
"YouTube videos should be 10 minutes long"
On YouTube, 10 minutes was an upload cap and then an ad rule, never a retention finding. YouTube introduced a 10-minute upload limit in March 2006, mainly to keep out copyrighted TV and film clips; it said over 99% of uploads were already shorter and that most users watched videos under about 3 minutes (YouTube Official Blog, March 2006). It raised the limit to 15 minutes for everyone on July 29, 2010 (YouTube Official Blog), and from December 2010 let accounts in good standing upload longer than 15 minutes (YouTube Official Blog), the default that survives today. Separately, YouTube's help page allowed mid-roll ads only on videos of 10 minutes or longer until mid-2020 (YouTube Help, June 2020 capture), when it lowered the line to 8 minutes (YouTube Help, August 2020 capture). YouTube's own early advice for creators was about the opening, not the length: its 2011 Creator Playbook framed the start of a video as "the first 15 seconds" (YouTube Official Blog). What to use instead: YouTube rewards watch time and names no ideal length; the biggest channels' videos split between under five minutes and over twenty (above).
"47% of a video ad's value is delivered in the first three seconds"
The original measured who created the value, not which seconds carried it. In March 2015 Facebook published a Nielsen analysis of 173 Brand Effect studies estimating that people who watched less than three seconds of a Facebook video ad created up to 47 percent of the total campaign value, and people who watched less than ten seconds up to 74 percent, "depending on the metric" (Facebook for Business, March 2015, Internet Archive capture). Short viewers are numerous, so they add up to a large share of a campaign's effect. In February 2016 Facebook's own post restated the finding as value "delivered in the first three seconds" (Facebook for Business, Internet Archive capture), which is the wording most lists repeat, usually without "up to"; some trade coverage turned it into a "47% lift" in ad recall. What to use instead: the original wording, with "up to" and "depending on the metric".
"TikTok ads perform best at 21 to 34 seconds"
The evidence is one ad sample, and most top ads fall outside the window. In August 2021 TikTok reported that 1 in 4 of its top-performing ad videos ran 21 to 34 seconds, and that ads of that length saw on average a 1.6% lift in impressions (TikTok for Business, Internet Archive capture); roundups often print it as "1.6x". A December 2021 TikTok post reported a 280% lift in conversion for the same window, from a model with no published sample (TikTok for Business), and TikTok's current small-business guide still says 21-34 seconds performs best (TikTok for Business). Its "Creative Codes" say 90% of an ad's recall impact is captured within six seconds (TikTok for Business), while a May 2023 version of the same guide gave 80% of awareness impact (TikTok Creative Codes PDF); both cite an unpublished 2020 TikTok analysis. What to use instead: "1 in 4 of TikTok's top ads in its 2021 sample ran 21 to 34 seconds".
"Keep video ads to 15 seconds"
This was Facebook's advice for mobile feeds in 2017 and is no longer on Meta's help page. In June 2017 Facebook advised advertisers to consider delivering a video's message in 15 seconds or less (Facebook for Business, Internet Archive capture), and Meta's "About video ads" help article, as archived in 2022 and May 2023, told advertisers to make videos of 15 seconds or less (Meta Business Help Center, Internet Archive capture). The live article now says to feature the product or message early and gives no length. LinkedIn's video-ad page, as archived in March 2025, cited an internal 2018 study in which videos under 30 seconds had a 200% lift in completion rates, without a sample (LinkedIn Marketing Solutions, Internet Archive capture). What to use instead: each platform's current length limits in the table above, and its own finish-rate data where it publishes any.
"75% of viewers abandon a poor-quality video within four minutes"
This is what people said in a survey, not what they did. Conviva's March 2015 release on a survey of 750 streaming viewers aged 26 to 34 found that only 25 percent would keep watching more than four minutes of a poor-quality stream, which it headlined as 75% abandoning within four minutes; One in three said they leave as soon as playback degrades (Conviva press release, Internet Archive capture). Conviva sells streaming analytics. What to use instead: the measured abandonment figures in the section on slow starts and stalls.
"Four out of five users click away if a video stalls"
A sentence in a Google essay, with no study behind it. In a 2012 Think Quarterly essay on speed, Google's head of infrastructure Urs Hoelzle wrote that Four out of five internet users will click away if a video stalls while loading, citing no source (Think Quarterly, Internet Archive capture). Our video editing statistics page carries the full trace.
Traced on our other pages
Four more numbers often quoted about video length and attention are traced in full elsewhere on this site. "The average YouTube video is 11.7 minutes" is a mean of every public YouTube video as of the end of 2018, before Shorts: see the YouTube video length study. "20% of viewers click away within 10 seconds" is a rounded 2010 benchmark of short clips: see video editing statistics. "Viewers retain 95% of a message in video against 10% in text" has no study behind it: see video advertising statistics. The brain processing images in 13 milliseconds and visuals "60,000 times faster than text" are traced on video thumbnail and CTR statistics.
We started from the questions people search for about video length and retention statistics and looked for the organization that actually produced each answer. Every figure on this page sits in an evidence ledger with its source, the exact table or paragraph it came from, the measurement period, the population measured, and the date we checked it. This edition holds 221 figures from 40 publishers.
On October 28, 2026, each of the 199 sourced figures on this page was re-fetched with the fetch cache cleared and matched against the recorded wording; 183 matched on that pass, from the publisher's page or file or a dated Internet Archive capture. Google's help center answered this machine with a rate-limit page that day, so the 11 YouTube Help and Google Ads Help figures were matched against Internet Archive captures from August to October 2026, after being read on the live pages earlier the same day. Instagram's Help Center and Snap's Business Help Center build their text with JavaScript, so three figures were matched in a headless browser. A TikTok blog post that timed out and the Brame paper, which PubMed Central hid behind a browser check and which we re-read through Europe PMC's full-text API, matched on retry the same day. 87 figures cite Internet Archive captures: mostly pages from 2006 to 2017 traced in the popular-numbers section, and pages that refuse scripts, such as Facebook's and X's. We left out what we could not read as text or check: Wistia's full 2026 table by length and its 2012 and 2016 charts, which are images; Nielsen's 2021 YouTube share, shown only in a chart; a Vidyard 2018 report hosted only by a third party; reports behind sign-up forms; and Alphabet's remarks on Shorts revenue per watch hour, which give no number. The 22 figures marked as our calculations are listed with their formulas below.
We only cite the producer: government agencies, regulators, company filings and official posts, and the survey owner's own report. We do not cite statistics roundups, Statista-style aggregators, or salary sites without a public method. We did not bypass paywalls or sign-up forms; where a full report was gated, we used only the figures its publisher states publicly.
Figures marked "our calculation" are arithmetic on the cited numbers or on the public dataset of our YouTube video length study (videos.csv, public YouTube data read on October 26, 2026), and anyone can reproduce them:
Count of videos with minutes >= 8.0 in videos.csv (1,661) divided by all rows (2,859) = 0.5810. Threshold from YouTube Help (see the PLT row for mid-roll ads)
For each channel, Spearman rank correlation (ties averaged) between minutes and views_when_listed across its latest long-form videos; median across 96 channels = 0.1101. 1 would mean a longer video always had more views; 0 means no relationship. Views were read when the videos were listed, so older videos had longer to gather views. The 158 videos listed without a view count are left out, and channels with fewer than 5 counted videos are skipped
Partial Spearman correlation of minutes and views controlling for the video's position in the channel's Videos tab (newest first), median across 96 channels = 0.1236
This edition contains no Mark Studios customer data.
Limitations
Retention benchmarks come from companies that sell video tools, measuring their own customers. Wistia and Vidyard sell business video hosting, and their samples are marketing, sales and training videos, not social feeds. Buffer and Socialinsider sell social media tools; Buffer does not say how its TikToks were sampled or when.
The sources measure different things. Wistia reports the average share of a video watched per play, Vidyard the share of viewers who finish, Buffer the median seconds watched, and Socialinsider average views. The tables name the metric; do not compare levels across them.
View counts changed meaning. YouTube counts a Shorts view at every start or replay since March 31, 2025, and a view on every format from the first frame since August 24, 2026. Counts from before and after those dates are not comparable, and short-form counts are not comparable with long-form ones.
Our own calculations have limits. The length study covers the latest long-form videos of the 97 most-subscribed channels, which lean toward music and entertainment. Views were read once, on October 26, 2026, so older videos had longer to collect them; we controlled for upload order, but a correlation says nothing about what causes what. The seconds-watched ranges multiply Wistia's band averages by each band's shortest and longest length, because Wistia gives no average length per band.
Most ad research is the platforms describing their own products. The Facebook, TikTok, Google and Snap figures come from the platforms or from studies they paid for, mostly without published samples, and several date from 2015 to 2017.
The playback studies are old. The Akamai and Conviva papers use data from 2010 and 2011, were co-written by researchers at those companies, and describe desktop-era streaming. Conviva's latest State of Streaming report we could read covers the second quarter of 2022.
Attention research is small and specific. Gloria Mark's studies logged 13 to 40 office workers at single organizations and measure how often they switch windows, not attention to video. The lecture studies describe classrooms, not screens.
Nielsen's Gauge counts viewing on U.S. TV sets only, and Nielsen changes its method from the September 2026 data. Ofcom's figures describe the UK.
Limits and definitions are a snapshot read from each platform's own pages on October 28, 2026, several through Internet Archive captures or a headless browser because the live pages refuse scripts. Snap's two pages give different ad lengths; both are shown.
Mark Studios. "Video Length and Retention Statistics." Last verified Oct 28, 2026. https://www.markstudios.com/research/video-length-and-retention-statistics
APA
Mark Studios. (2026, October 28). Video length and retention statistics. https://www.markstudios.com/research/video-length-and-retention-statistics
MLA
“Video Length and Retention Statistics.” Mark Studios, 28 Oct. 2026, www.markstudios.com/research/video-length-and-retention-statistics.
Chicago
Mark Studios. “Video Length and Retention Statistics.” Last modified October 28, 2026. https://www.markstudios.com/research/video-length-and-retention-statistics.
BibTeX
@misc{markstudios_video_length_and_retention_statistics_2026,
  author = {{Mark Studios}},
  title = {{Video Length and Retention Statistics}},
  year = {2026},
  month = oct,
  url = {https://www.markstudios.com/research/video-length-and-retention-statistics},
  note = {Last verified 2026-10-28}
}
Our calculations and the evidence table are free to reuse with attribution and a link to this page. Each underlying figure remains the claim of its original publisher, and some publishers ask for a link when their figures are reused.
We re-verify every figure quarterly and when a major source publishes a new edition. The next scheduled review is January 2027. Corrections go to contact@markstudios.com.
Oct 28, 2026: First published with 221 figures from 40 publishers, each checked against its original source.
Frequently asked questions
How long should a video be?
No single length wins. In Wistia's business video data the share watched falls as videos get longer, from 50% for videos under a minute to 15% for videos over an hour in 2021, but the minutes watched rise. On the biggest YouTube channels the latest long-form videos ran a median of 12.3 minutes, and within a channel length barely tracked views (a median correlation of 0.11). On Instagram, reels over 3 minutes are not recommended to new audiences.
What is the average YouTube video length?
The 2,859 latest long-form videos of the 97 most-subscribed channels ran a median of 12.3 minutes in October 2026, in our YouTube video length study. The median hides two camps: 35% ran under five minutes and 38% ran 20 minutes or longer.
What counts as a view on YouTube?
Since August 24, 2026, a view counts from the first frame on every format, including long-form videos and live streams. The previous definition, clicking to watch or watching past the first few seconds, is now called an engaged view, and YouTube still uses it for earnings and retention metrics. For ads, Google charges for a skippable in-stream view at 30 seconds, or the whole ad if shorter.
What is a good audience retention rate?
It depends on the length and on what is counted. Wistia's 2026 report put average engagement for business videos under a minute at 52%. Vidyard found that 65% of viewers finished videos under a minute and 20% finished videos over 20 minutes in 2024. YouTube Studio compares each video with the channel's 10 latest videos of similar length, a fairer benchmark than any industry average.
Is the human attention span 8 seconds?
No study has measured it. The figure of 8 seconds was on a statistics website, Statistic Brain, by February 2012, labelled 2012 and credited only to The Associated Press; Microsoft Canada reprinted a later version in 2015, crediting that site. The closest real measurement, by Gloria Mark of UC Irvine, found office workers stayed on one screen for a mean of 47.0 seconds before switching, which measures task switching, not attention.
How long will viewers wait for a video to load?
About two seconds. In Akamai data on 23 million views, viewers began abandoning videos that took more than 2 seconds to start, and each extra second raised abandonment by about 5.8%. In the second quarter of 2022, Conviva measured an average start time of 4.62 seconds across its customers' streaming apps.
Are people watching less long-form video?
Not on the TV. YouTube took 15.8% of U.S. TV-set viewing in August 2026, a record in Nielsen's Gauge, and YouTube said in early 2025 that viewers watch more than 1 billion hours a day on TV screens. Shorts' 200 billion daily views count every start or replay, so they cannot be compared with long-form views.
How often is this page updated?
Every figure is re-checked against its original source each quarter, and sooner when a major source publishes a new edition, such as Wistia's State of Video report, Vidyard's benchmark report or a new month of Nielsen's Gauge. The Last verified date changes only after that check, and each change is recorded in the change log.