Federal agencies buy training films, public service announcements and multimedia support every year. We read every federal contract coded film and video production since fiscal 2008 to see how much they spend, who wins the work and how much of it is competed.
Federal agencies obligated $24.0 million in fiscal 2025 on contracts coded film and video production, with 105 vendors: about $3 of every $100,000 the government spent on contracts that year. See details
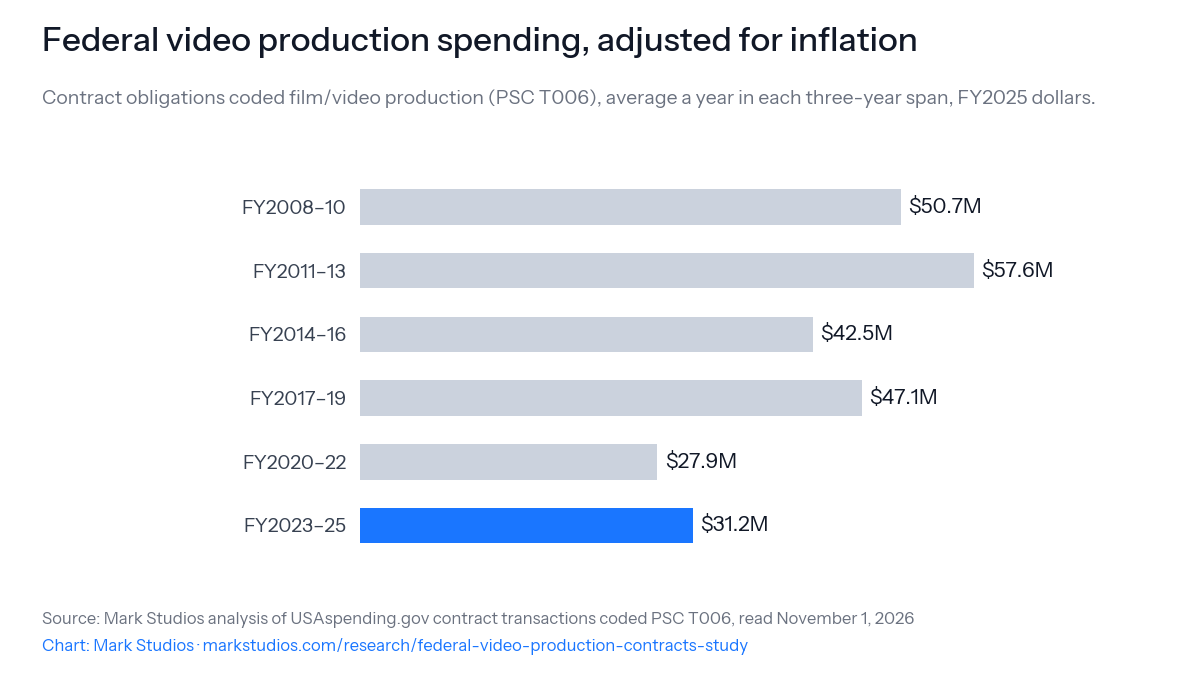
Adjusted for inflation, the spending averaged $31.2 million a year in fiscal 2023–2025, 46% below fiscal 2011–2013 ($57.6 million); the single-year high was fiscal 2011, at $88.5 million in 2025 dollars. See details
Fiscal 2025 had the fewest new video production awards of $25,000 or more of any year since 2008: 56, against 104 to 107 a year in fiscal 2021–2023. See details
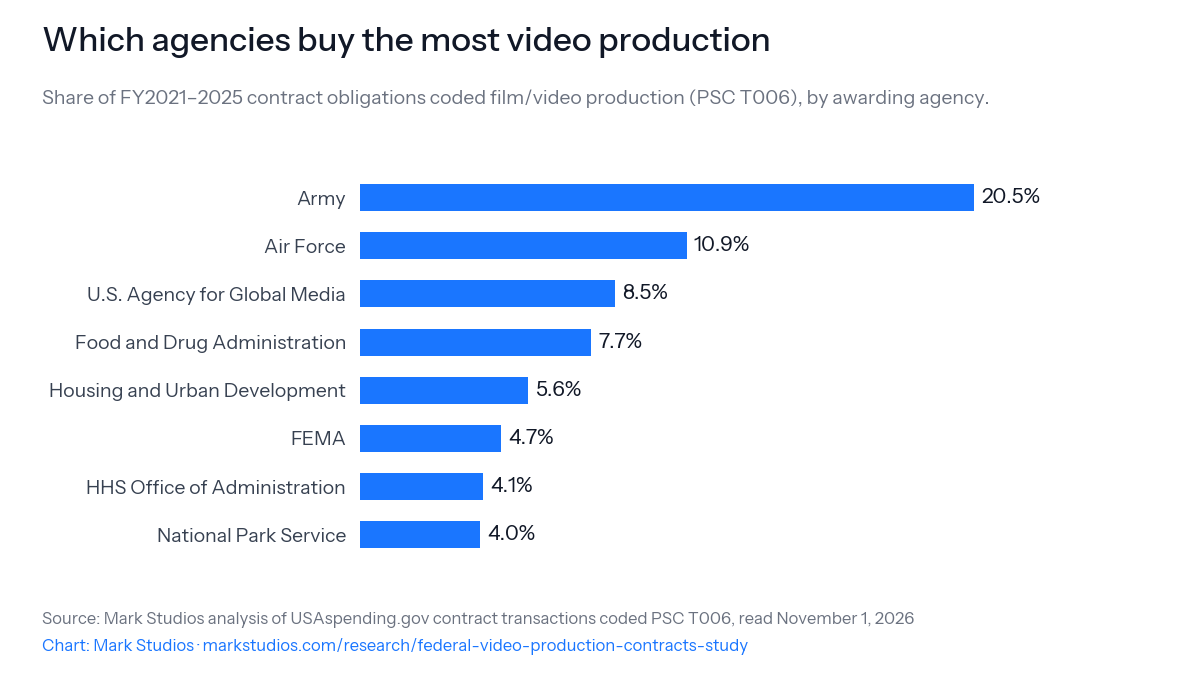
The Defense Department placed 41.4% of fiscal 2021–2025 dollars, the Army alone 20.5%, followed by the Air Force (10.9%), the U.S. Agency for Global Media (8.5%) and the FDA (7.7%). See details
Small businesses won 79.7% of the dollars, against a government-wide goal of 23%; 25.1% were sole-source awards under a statute, 98.5% of them to firms in the SBA's 8(a) program. See details
41% of competed awards drew a single offer (200 of 488), and 63.1% of the dollars paid for work performed in Washington, D.C., Virginia or Maryland. See details
How much do federal agencies spend on video production?
We read every federal contract transaction coded T006, film and video production, in the government's product and service code list (PSC manual), from fiscal 2008 to fiscal 2026, out of USAspending.gov. In fiscal 2025 (October 2024 to September 2025), agencies obligated $24.0 million on 336 such contract actions with 105 vendors. That is about $3 of every $100,000 of the $779 billion agencies obligated on contracts that year. Over fiscal 2021–2025 the spending averaged $28.6 million a year, and fiscal 2008–2025 added up to $591.0 million ($770.9 million in 2025 dollars).
Fiscal 2026 stands at $22.0 million so far. It is provisional: Defense Department contract data reach USAspending on a 90-day delay (USAspending), so its last quarter is still arriving.
Is federal spending on video going up or down?
Down. Adjusted for inflation with the consumer price index (BLS CPI-U), the spending averaged $31.2 million a year in fiscal 2023–2025, 46% below the $57.6 million a year of fiscal 2011–2013. The single-year high was fiscal 2011, at $88.5 million in 2025 dollars ($61.7 million at the time); fiscal 2025 was 73% below it.
Federal video production spending, adjusted for inflationContract obligations coded film/video production (PSC T006), average a year in each three-year span, FY2025 dollars.Use this chart on your site
The number of awards fell further. Fiscal 2025 brought 56 new video production awards of $25,000 or more, the fewest of any year since 2008, against 104 to 107 a year in fiscal 2021–2023 and a high of 170 in fiscal 2010. Fiscal 2026 has 65 so far, with the Defense Department's last quarter still to come.
Every fiscal year
Fiscal year
Obligations
In FY2025 dollars
New awards of $25,000+
Vendors
Small-business share
FY2008
$19.6M
$29.3M
115
250
83%
FY2009
$40.3M
$60.4M
120
274
57%
FY2010
$42.4M
$62.4M
170
328
70%
FY2011
$61.7M
$88.5M
157
376
50%
FY2012
$34.6M
$48.5M
123
328
65%
FY2013
$25.9M
$35.7M
112
244
79%
FY2014
$33.8M
$45.8M
105
213
85%
FY2015
$28.1M
$38.0M
102
183
82%
FY2016
$32.7M
$43.8M
126
199
86%
FY2017
$37.3M
$49.0M
141
246
90%
FY2018
$36.4M
$46.6M
94
221
92%
FY2019
$36.4M
$45.7M
89
181
89%
FY2020
$18.9M
$23.5M
75
150
78%
FY2021
$24.7M
$29.6M
104
178
70%
FY2022
$27.5M
$30.6M
107
189
76%
FY2023
$35.6M
$37.7M
105
179
77%
FY2024
$31.1M
$32.0M
90
147
82%
FY2025
$24.0M
$24.0M
56
105
94%
FY2026 (provisional)
$22.0M
$21.3M
65
102
97%
Which agencies buy the most video production?
The Defense Department placed 41.4% of fiscal 2021–2025 obligations, and the Army alone 20.5%. Its largest award in the period, a five-year Army contract for Enterprise Multimedia Center support, has $13.2 million obligated so far. Outside defense, the biggest buyers were the U.S. Agency for Global Media (8.5%), the Food and Drug Administration (7.7%), the Department of Housing and Urban Development (5.6%) and the Federal Emergency Management Agency (4.7%).
Which agencies buy the most video productionShare of FY2021–2025 contract obligations coded film/video production (PSC T006), by awarding agency.Use this chart on your site
Office of the Assistant Secretary for Administration
Department of Health and Human Services
$5.8M
4.1%
National Park Service
Department of the Interior
$5.7M
4.0%
Department of State
Department of State
$5.5M
3.8%
Defense Media Activity
Department of Defense
$3.9M
2.7%
Defense Logistics Agency
Department of Defense
$3.6M
2.6%
Federal Bureau of Investigation
Department of Justice
$3.0M
2.1%
Who wins federal video production contracts?
408 vendors received money in fiscal 2021–2025, but the ten biggest took 51.9% of the dollars (grouped by parent company as USAspending records it). Small businesses, as the contracting officer classed them, won 79.7%, against the government-wide goal of 23% of prime contract dollars set in federal law (15 U.S.C. 644(g)). 41% of the dollars went through small-business set-asides, women-owned businesses won 17.4% and veteran-owned businesses 8.9%.
A quarter of the money went out as sole-source awards. 25.1% of fiscal 2021–2025 dollars were sole-source awards under statutory authority (FAR 6.302-5), and 98.5% of those went to firms in the Small Business Administration's 8(a) program, whose certified firms can receive sole-source contracts. 8(a) firms won 45.7% of all the dollars. The hourly rates vendors list for editors, videographers and animators are in our GSA video production rates study.
The 10 biggest vendors, fiscal 2021–2025
Vendor (as USAspending lists it)
Obligations
Share
PCI PRODUCTIONS LLC
$19.0M
13.3%
ROMAN MEDIAWORKS, LLC
$13.1M
9.1%
RED CARROT INC
$7.8M
5.4%
CHENEGA ENTERPRISE SYSTEMS & SOLUTIONS, LLC
$6.8M
4.8%
INTERFACE MEDIA GROUP INC
$6.7M
4.7%
THE ADVERTISING COUNCIL INC
$6.7M
4.7%
THE CHENEGA CORPORATION
$5.0M
3.5%
VENTANA PRODUCTIONS, INC
$3.3M
2.3%
K-MAR INDUSTRIES INC
$3.0M
2.1%
ROCKET MEDIA GROUP, LLC
$2.9M
2.0%
How competitive are the contracts?
42.3% of fiscal 2021–2025 dollars were not competed. Among the 488 competed awards that report how many offers they drew, 200 (41%) drew a single offer, and the median was 2. Most awards are small: the median award made in the period has obligated $29,940 so far, and 739 of 838 (88%) are under $250,000, while 25 awards of $1 million or more hold 50.6% of the dollars.
Where is the work done?
63.1% of fiscal 2021–2025 dollars paid for work performed in Washington, D.C. (28.3%), Virginia (27.2%) or Maryland (7.7%), the Washington area. California was next, at 7.2%.
Why we count the T006 code
T006 records what the government bought. The industry codes for video production firms (NAICS 512110) and post-production firms (512191) record who sold it, and they are a poor guide: only 33.4% of fiscal 2021–2025 dollars awarded under 512110 were coded T006, while the rest bought audio-visual services, professional and management support, conference facilities and special studies. T006 also misses video bought inside larger contracts. Of the $362.5 million obligated in fiscal 2021–2025 on contracts whose records mention "video production", 28% was coded T006, and the rest sat under audio-visual, professional support, advertising, public-relations, communications and IT codes. So treat the T006 total as a floor.
What this means
Federal video is a small-business market. 79.7% of the dollars go to small firms, and about a quarter arrive as 8(a) sole-source awards.
Most orders are small and local to Washington. The median award is $29,940, and 63% of the dollars pay for work in D.C., Virginia and Maryland.
Many solicitations draw one bid. 41% of competed awards had a single offer.
Data.USAspending.gov's custom download of prime contract transactions (award types A to D: blanket purchase agreement calls, purchase orders, delivery orders and definitive contracts) with product or service code T006 and action dates from October 1, 2007 to September 30, 2026, read November 1, 2026 through the public API: 15,386 transactions. Dollars are net obligations (the federal_action_obligation field), so a deobligation reduces the year it is booked in, and years are federal fiscal years (October to September).
Inflation. Fiscal-year averages of the monthly CPI-U (CUUR0000SA0), scaled to fiscal 2025. October 2025 was never published because of the government shutdown, so fiscal 2026 averages 11 months.
Awards, vendors and competition. An award's size is the net obligation of all its transactions to date; "new awards" count base actions by the fiscal year they were made. Vendors are grouped by USAspending's parent company identifier. Small-business status is the contracting officer's determination on each action; competition and offer counts come from the award's base action. Context figures (all federal contracts, the NAICS cross-check and the "video production" keyword search) come from the same API.
Limitations
A floor, not a total. Video bought inside advertising, public-relations, communications or IT contracts carries those codes, and grants are not included.
Small purchases are missing. Agencies must report contract actions over the micro-purchase threshold (FAR 4.606), now $15,000 (FAR 2.101) and $10,000 as of 2022 (USAspending); smaller buys, such as many made on government purchase cards, usually are not in the data, so counts of small awards across the years are not like for like.
Fiscal 2026 is provisional. Defense Department data arrive 90 days late.
Descriptions and classifications are the agencies' own. We did not re-code awards, and a few T006 awards buy stock music or photography rather than video.
Mark Studios. "Federal Video Production Contracts Study." Published November 1, 2026. https://www.markstudios.com/research/federal-video-production-contracts-study
APA
Mark Studios. (2026, November 1). Federal video production contracts study. https://www.markstudios.com/research/federal-video-production-contracts-study
MLA
“Federal Video Production Contracts Study.” Mark Studios, 1 Nov. 2026, www.markstudios.com/research/federal-video-production-contracts-study.
Chicago
Mark Studios. “Federal Video Production Contracts Study.” Last modified November 1, 2026. https://www.markstudios.com/research/federal-video-production-contracts-study.
BibTeX
@misc{markstudios_federal_video_production_contracts_study_2026,
  author = {{Mark Studios}},
  title = {{Federal Video Production Contracts Study}},
  year = {2026},
  month = nov,
  url = {https://www.markstudios.com/research/federal-video-production-contracts-study},
  note = {Last verified 2026-11-01}
}
Our counts and the CSVs are free to reuse under CC BY 4.0 with a link to this page. The underlying USAspending data are public.
We plan to rerun the read each January, once the Defense Department's fourth quarter is in, which will make fiscal 2026 final. Corrections go to contact@markstudios.com.
November 1, 2026: First published.
Frequently asked questions
How much does the federal government spend on video production?
In fiscal 2025, agencies obligated $24.0 million on contracts coded film and video production (PSC T006), and $28.6 million a year on average in fiscal 2021–2025. Video bought inside larger advertising, communications or IT contracts is coded elsewhere, so this is a floor.
Which federal agencies buy the most video production?
The Defense Department, with 41.4% of fiscal 2021–2025 obligations; the Army alone placed 20.5%. Outside defense, the biggest buyers were the U.S. Agency for Global Media (8.5%), the Food and Drug Administration (7.7%) and the Department of Housing and Urban Development (5.6%).
Do small businesses win federal video production contracts?
Mostly, yes. Small businesses won 79.7% of fiscal 2021–2025 obligations, far above the 23% government-wide goal in federal law, and firms in the SBA's 8(a) program won 45.7%. About 41% of the dollars went through small-business set-asides.
How competitive are federal video production contracts?
Less than it may seem. 42.3% of fiscal 2021–2025 dollars were not competed, mostly 8(a) sole-source awards, and 41% of the competed awards that report an offer count drew only one offer. The median award was $29,940.
Can I use this data?
Yes. The per-award CSV (863 awards from fiscal 2021–2025, with agency, vendor, amount, competition and a USAspending link) and the fiscal-year table are free to reuse under CC BY 4.0 with a link to this page.