Federal agencies employ their own video producers, photographers and public affairs staff. We counted their civilian video, photography, visual information, public affairs and writing staff in 18 OPM workforce snapshots from 2015 to 2026, to see how the fall in federal employment since December 2024 reached them.
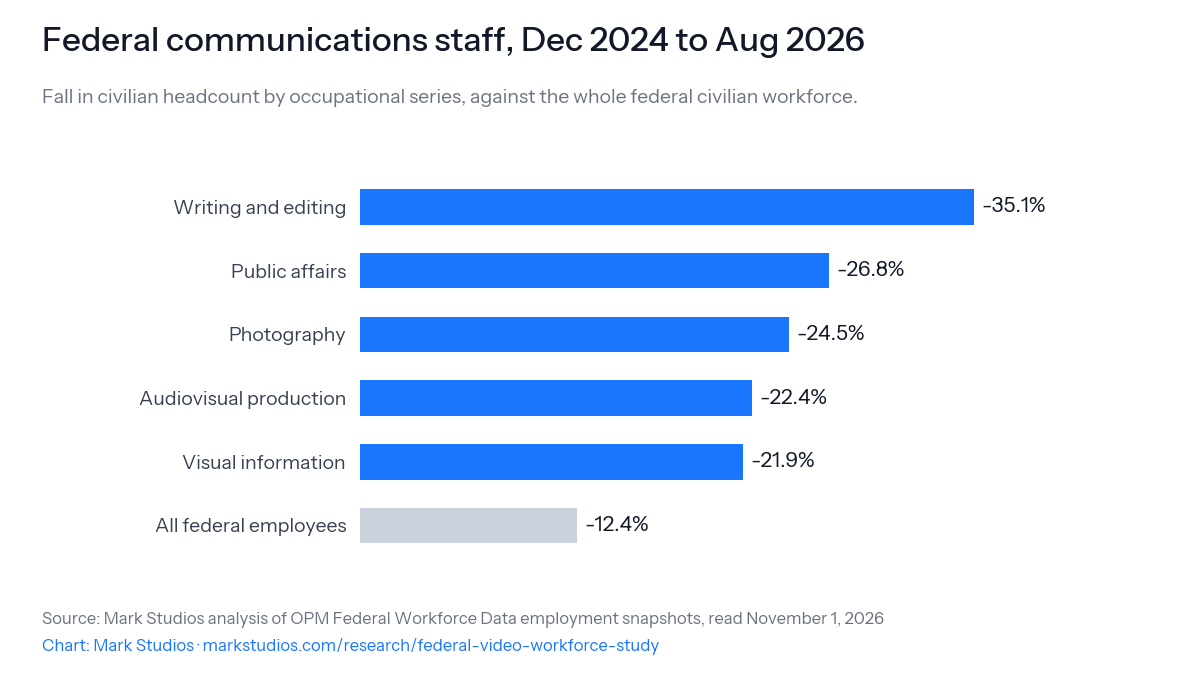
The federal government employed 726 civilian audiovisual production specialists in August 2026, down 22.4% from 936 in December 2024; the whole federal civilian workforce fell 12.4% over the same months. See details
Public affairs staff fell 26.8%, from 7,718 to 5,652, after growing from 5,697 in September 2015 to a peak of 7,718 in December 2024; writing and editing staff fell 35.1%. See details
Health and Human Services lost 51.2% of its public affairs staff (361 to 176), the steepest fall among the departments with 150 or more such employees. See details
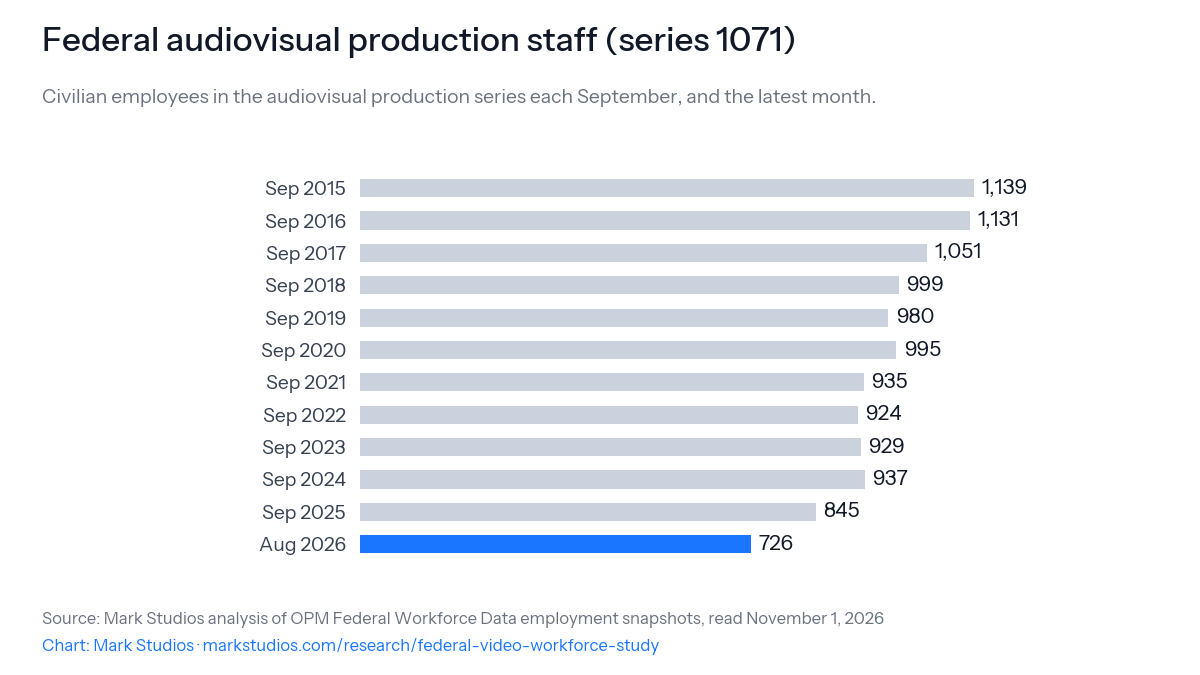
Audiovisual production staff were already shrinking: 1,139 in September 2015, 726 now, down 36.3%. See details
The Defense Department employs 43.4% of them (315, down from 379); the U.S. Agency for Global Media fell from 90 to 64. See details
Outside the Defense Department, whose pay OPM withholds, the median audiovisual production specialist is paid $129,904 a year in basic pay; most are GS-12 or GS-13. See details
How much did federal video and communications staff shrink?
We read the Office of Personnel Management's monthly employment snapshots of the federal civilian workforce (OPM Federal Workforce Data) for five communications occupations. From December 2024 to August 2026, the audiovisual production series (1071) fell from 936 employees to 726, down 22.4%. The whole federal civilian workforce fell 12.4%, from 2,312,301 to 2,024,832, so these occupations shrank faster than the government around them.
Federal communications staff, Dec 2024 to Aug 2026Fall in civilian headcount by occupational series, against the whole federal civilian workforce.Use this chart on your site
Which agencies lost the most public affairs staff?
Public affairs, the largest of the five, fell from 7,718 to 5,652 (-26.8%). It had grown from 5,697 in September 2015 to 7,718 in December 2024, so it is now below its 2015 level. Among departments with 150 or more public affairs employees in December 2024, Health and Human Services fell the most: -51.2%, from 361 to 176.
Public affairs staff in the 12 largest departments
Department
Dec 2024
Aug 2026
Change
Department of Defense
2,804
2,316
-17.4%
Department of Agriculture
745
444
-40.4%
Department of Homeland Security
571
433
-24.2%
Department of Veterans Affairs
474
359
-24.3%
Department of the Interior
453
300
-33.8%
Department of Health and Human Services
361
176
-51.2%
Department of the Treasury
305
187
-38.7%
Environmental Protection Agency
288
204
-29.2%
Department of Justice
268
232
-13.4%
Department of State
249
175
-29.7%
National Aeronautics and Space Administration
197
122
-38.1%
Small Business Administration
175
190
8.6%
Were video jobs shrinking before 2025?
Yes, slowly. The audiovisual production series had 1,139 employees in September 2015 and 937 in September 2024, while the whole federal workforce grew. With the drop since December 2024, it is down 36.3% from 2015.
Federal audiovisual production staff (series 1071)Civilian employees in the audiovisual production series each September, and the latest month.Use this chart on your site
The Defense Department employs 43.4% of the audiovisual production staff (315 in August 2026, down from 379). Homeland Security, Veterans Affairs and the U.S. Agency for Global Media follow; the Agency for Global Media went from 90 to 64. Only 34.0% work in Washington, D.C., Maryland or Virginia, against 63.1% of the dollars agencies spend on video production contracts, in our federal video production contracts study.
Audiovisual production staff by department
Department
Dec 2024
Aug 2026
Change
Department of Defense
379
315
-16.9%
Department of Homeland Security
88
80
-9.1%
Department of Veterans Affairs
86
65
-24.4%
U.S. Agency for Global Media
90
64
-28.9%
Department of Health and Human Services
58
46
-20.7%
Department of State
29
21
-27.6%
Department of Commerce
25
20
-20.0%
Social Security Administration
27
17
-37.0%
Department of the Interior
37
16
-56.8%
Department of Justice
19
14
-26.3%
What do they earn?
OPM withholds pay for every Defense Department record. Across the other 383 audiovisual production specialists whose pay it publishes, the median is $129,904 a year in basic pay plus locality. 85.4% are on the General Schedule, most at GS-12 (209), GS-13 (189) and GS-11 (146). The basic pay of those 383 people alone adds up to $49.1 million a year, 2.0 times the $24.0 million agencies obligated on video production contracts in fiscal 2025.
What this means
Federal communications shrank faster than the government. Every one of the five series fell more than the 12.4% drop in all federal jobs.
Data. OPM's Federal Workforce Data employment files (downloads, API): record-level snapshots of the federal civilian workforce on the last day of a month, read November 1, 2026. We used every September from 2015 to 2025, December 2024, and every quarter after it to August 2026: 18 snapshots. Headcount is the sum of the records in each occupational series: 1071 audiovisual production, 1084 visual information, 1060 photography, 1035 public affairs and 1082 writing and editing. Employees are civilians only; uniformed military personnel are excluded (OPM definitions).
Pay. Annualized adjusted basic pay (basic pay plus locality), from records where OPM publishes it. OPM redacts some fields to comply with its data release policy, including every Defense Department pay record in this series.
Limitations
Some agencies are not covered. OPM's data leave out intelligence agencies, the Postal Service and some others (OPM).
Series are job classifications. A video producer classed as public affairs or visual information counts there, and some audiovisual staff do audio or broadcast engineering.
Snapshots are revised. OPM publishes new versions of recent months; we used the current version of each on the read date.
Pay excludes the Defense Department and the other redacted records, so the median describes the rest.
Mark Studios. "Federal Video and Public Affairs Workforce Study." Published November 1, 2026. https://www.markstudios.com/research/federal-video-workforce-study
APA
Mark Studios. (2026, November 1). Federal video and public affairs workforce study. https://www.markstudios.com/research/federal-video-workforce-study
MLA
“Federal Video and Public Affairs Workforce Study.” Mark Studios, 1 Nov. 2026, www.markstudios.com/research/federal-video-workforce-study.
Chicago
Mark Studios. “Federal Video and Public Affairs Workforce Study.” Last modified November 1, 2026. https://www.markstudios.com/research/federal-video-workforce-study.
BibTeX
@misc{markstudios_federal_video_workforce_study_2026,
  author = {{Mark Studios}},
  title = {{Federal Video and Public Affairs Workforce Study}},
  year = {2026},
  month = nov,
  url = {https://www.markstudios.com/research/federal-video-workforce-study},
  note = {Last verified 2026-11-01}
}
Our counts and the CSVs are free to reuse under CC BY 4.0 with a link to this page. The underlying OPM data are public.
OPM publishes a new snapshot each month. We plan to update this page every quarter. Corrections go to contact@markstudios.com.
November 1, 2026: First published.
Frequently asked questions
How many video producers does the federal government employ?
In August 2026, 726 civilian federal employees worked in the audiovisual production occupational series (1071), down from 936 in December 2024 and 1,139 in September 2015. Uniformed military personnel are not included.
How many federal public affairs jobs were cut?
Federal public affairs headcount (series 1035) fell from 7,718 in December 2024 to 5,652 in August 2026, down 26.8%, while all federal civilian employment fell 12.4%. The figures count people on the rolls, so they include retirements and resignations as well as layoffs.
Which agencies lost the most communications staff?
Among departments with 150 or more public affairs employees in December 2024, Health and Human Services fell the most, by 51.2%, followed by Department of Agriculture (-40.4%) and Department of the Treasury (-38.7%). The table on this page lists the twelve largest departments.
How much do federal video producers earn?
Outside the Defense Department, whose pay OPM does not publish, the median audiovisual production specialist was paid $129,904 a year in basic pay plus locality in August 2026, across 383 employees. Most sit at General Schedule grades 12 and 13.
Can I use this data?
Yes. The headcount table by snapshot and occupational series, and the public affairs table by department, are free to reuse under CC BY 4.0 with a link to this page. The underlying OPM data are public.