Every company selling video services through GSA's schedules lists the most it may charge the government per hour, by role. We read all 671 video production rates to see what editors, videographers and animators bill, and how that compares with what they earn.
Video editors on GSA schedule contracts have a median hourly ceiling rate of $97.47 (112 rates from 59 vendors); the middle half run $84.97 to $120.63. See details
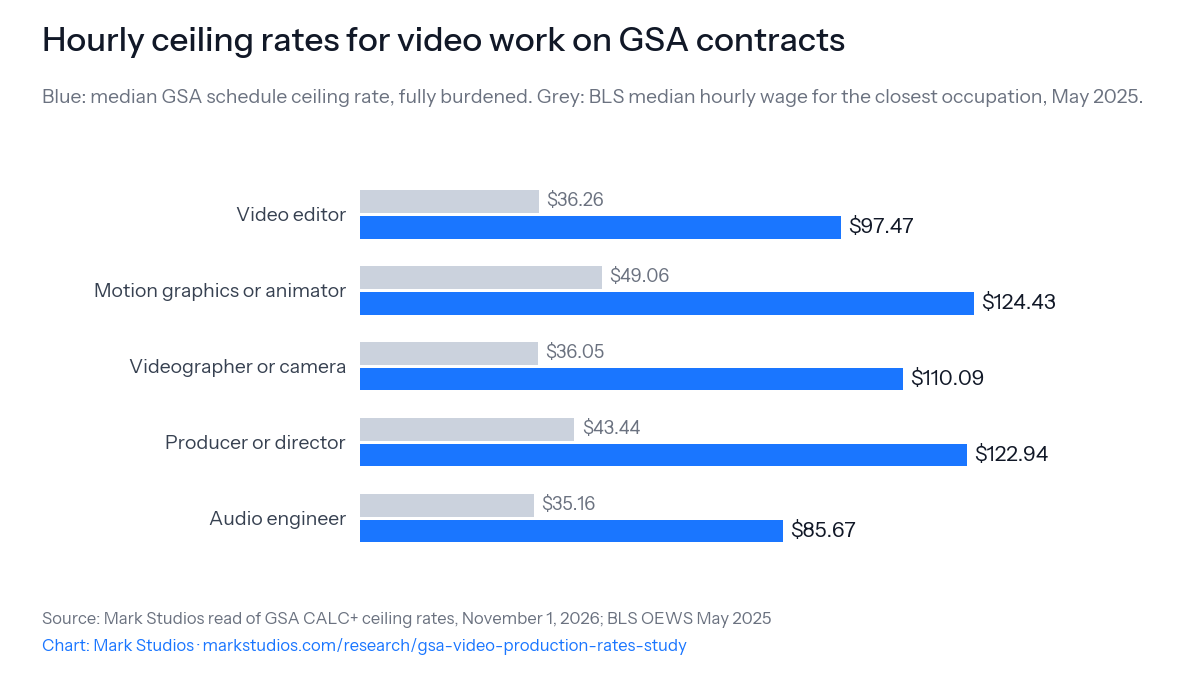
That is 2.7 times the $36.26 median hourly wage of film and video editors in the BLS's May 2025 estimates; across the video roles we could match, ceiling rates run 2.4 to 3.0 times the wage. Ceiling rates are fully burdened and include overhead, benefits and profit; wages do not. See details
Video production specialists carry the highest median, $125.94 an hour, just ahead of motion graphics designers and animators ($124.43) and producers and directors ($122.94) and videographers and camera operators ($110.09). See details
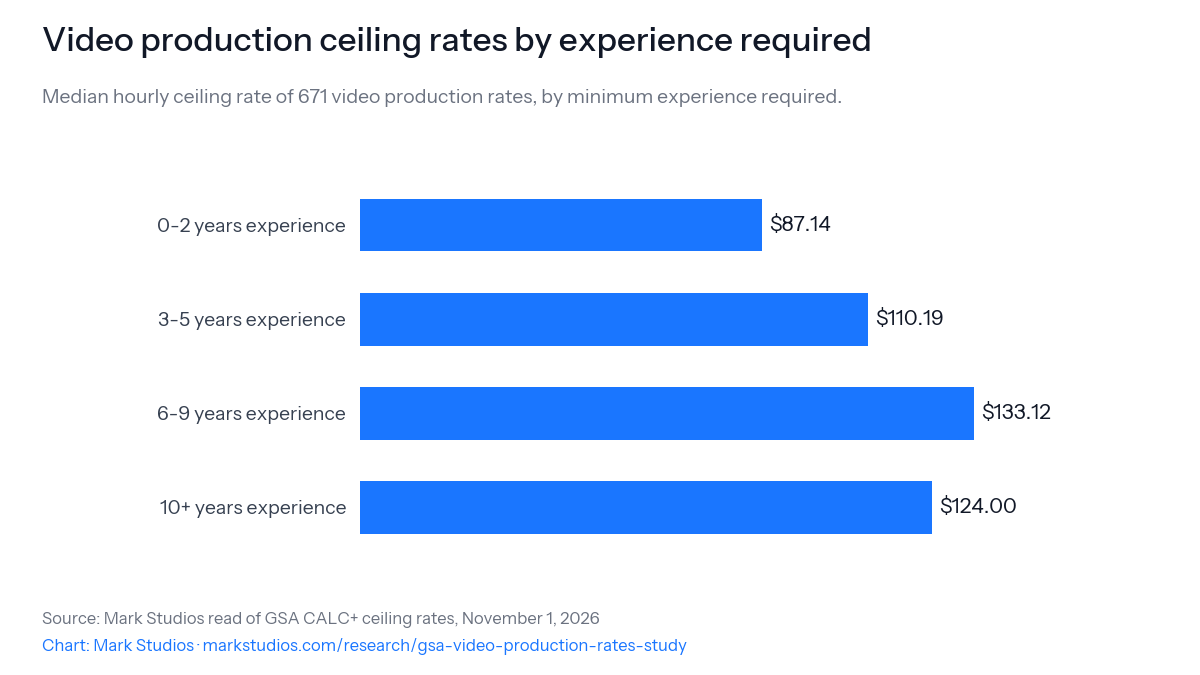
Experience moves the rate: video roles requiring 0-2 years have a median of $87.14, 3-5 years $110.19 and 6-9 years $133.12. See details
Small businesses hold 84.4% of the 671 video production rates, from 191 vendors in all. See details
What do government contracts charge per hour for video work?
Companies that sell services through the General Services Administration's Multiple Award Schedule list a not-to-exceed hourly rate for every labor category, and GSA publishes them in its CALC+ tool (GSA CALC+). We read every rate for video production roles on November 1, 2026: 671 rates from 191 vendors. The median ceiling rate across them is $110.09 an hour.
Hourly ceiling rates for video work on GSA contractsBlue: median GSA schedule ceiling rate, fully burdened. Grey: BLS median hourly wage for the closest occupation, May 2025.Use this chart on your site
$36.05 (Camera operators, television, video, and film)
3.0x
Video or multimedia producer, or director
108
63
$122.94
$97.23 to $141.86
$43.44 (Producers and directors)
2.8x
Video production specialist or assistant
77
33
$125.94
$98.52 to $150.60
–
–
Audio engineer or sound mixer
62
38
$85.67
$68.92 to $105.77
$35.16 (Sound engineering technicians)
2.4x
Graphic designer (for comparison)
774
352
$103.17
$81.47 to $128.10
$30.27 (Graphic designers)
3.4x
Photographer (for comparison)
153
62
$70.46
$53.45 to $104.19
$21.47 (Photographers)
3.3x
Video production specialists carry the highest median, $125.94 an hour, then motion graphics designers and animators ($124.43), producers and directors ($122.94) and videographers and camera operators ($110.09). Audio engineers and sound mixers are lowest, at $85.67. For comparison, graphic designers on the same schedules have a median of $103.17 and photographers $70.46.
What do video editors charge?
Video editors have a median ceiling rate of $97.47 an hour, across 112 rates from 59 vendors; the middle half run $84.97 to $120.63, and the full range is $43.32 to $423.92. Counting each vendor once, at its own median, gives $101.14. Editors needing 0-2 years of experience have a median of $87.14, and those needing 3-5 years $105.57.
Video editor rates by experience required
Minimum experience
Rates
Median ceiling rate
0-2 years
40
$87.14
3-5 years
50
$105.57
6-9 years
5
$115.42
10+ years
17
$101.78
How do the rates compare with what editors earn?
Film and video editors earned a median $36.26 an hour in May 2025, according to the Bureau of Labor Statistics (BLS OEWS), so the median ceiling rate is 2.7 times the median wage. Across the video roles with a matching occupation, ceiling rates run 2.4 to 3.0 times the wage, highest for videographers and camera operators (3.0x).
The two numbers measure different things. GSA describes schedule rates as fully burdened, not-to-exceed ceiling prices that vendors can discount on each order (GSA CALC+ guide), while the BLS wage rates it offers alongside them "do not include indirect costs or profit/fee estimates" (GSA). The gap is what a company adds to a wage to bill for it: benefits, overhead, unbilled time and profit, plus room to negotiate down.
Does experience raise the rate?
Yes, up to a point. Across all 671 video production rates, roles that require 0-2 years of experience have a median of $87.14 an hour, 3-5 years $110.19 and 6-9 years $133.12. Roles asking for 10 or more years have a median of $124.00, so the climb stops there.
Video production ceiling rates by experience requiredMedian hourly ceiling rate of 671 video production rates, by minimum experience required.Use this chart on your site
191 vendors hold the 671 video production rates, and small businesses hold 84.4% of them. Rates for work at the contractor's own site have a median of $116.54 (345 rates), and at the customer's site $105.43 (299). Who actually wins the orders is in our federal video production contracts study.
What this means
Use the median as a benchmark, not a price. A ceiling rate is a maximum; GSA expects agencies to seek discounts on each order.
Compare like with like. A freelance or agency hourly rate is closer to a ceiling rate than to a wage, since both have to cover overhead and unbilled time.
Animation costs more than editing. Motion graphics and animation carry a median 28% above video editing.
Mark Studios edits video for organizations, creators and brands. For what editors earn across the industry, see our video editing statistics.
How we ran the study
Rates. GSA's public CALC+ API returns every labor category on Multiple Award Schedule contracts with its current-year hourly ceiling price. On November 1, 2026 we read every record matching 25 keywords (video, videographer, film, editor, animator, motion graphics, multimedia, camera, producer, director, audio, sound, graphic designer, photographer and others): 9,750 records. One record is one labor category on one contract at one worksite.
Roles. We classed each record by its job title, with rules checked in order, so a title naming two roles counts under the first ("Videographer/Editor" is a video editor). We excluded titles that only share a word with video work: video game designers, video teleconference, network and CCTV technicians, event audio-visual technicians, microfilm, archaeology field directors, on-camera talent, and rates that bundle equipment or price a day. We read every distinct title in each role by hand. 1,598 records fall into a role, 671 of them video production roles.
Wages. National median hourly wages from the BLS Occupational Employment and Wage Statistics for May 2025 (OEWS): film and video editors (27-4032), special effects artists and animators (27-1014), camera operators (27-4031), producers and directors (27-2012), sound engineering technicians (27-4014), graphic designers (27-1024) and photographers (27-4021). Video production specialists have no single matching occupation.
Limitations
Ceilings, not prices paid. Orders can come in below these rates, and some listed rates may never have been billed. GSA's prices-paid data are restricted to users with .gov or .mil email.
Vendors with many tiers count more. A vendor listing Video Editor I to IV is counted four times; the one-vote-per-vendor median for editors ($101.14) shows the effect is small.
Titles are the vendors' own. A "multimedia producer" may also build e-learning; we classed by title and did not read each contract.
Wages are employees' pay. BLS wage estimates cover employees, not the self-employed, and are national medians across industries (BLS OEWS).
Mark Studios. "GSA Video Production Rates Study." Published November 1, 2026. https://www.markstudios.com/research/gsa-video-production-rates-study
APA
Mark Studios. (2026, November 1). GSA video production rates study. https://www.markstudios.com/research/gsa-video-production-rates-study
MLA
“GSA Video Production Rates Study.” Mark Studios, 1 Nov. 2026, www.markstudios.com/research/gsa-video-production-rates-study.
Chicago
Mark Studios. “GSA Video Production Rates Study.” Last modified November 1, 2026. https://www.markstudios.com/research/gsa-video-production-rates-study.
BibTeX
@misc{markstudios_gsa_video_production_rates_study_2026,
  author = {{Mark Studios}},
  title = {{GSA Video Production Rates Study}},
  year = {2026},
  month = nov,
  url = {https://www.markstudios.com/research/gsa-video-production-rates-study},
  note = {Last verified 2026-11-01}
}
Our counts and the CSV are free to reuse under CC BY 4.0 with a link to this page. The underlying GSA and BLS data are public.
GSA updates the rates daily as contracts change. We plan to rerun the read every six months and after each BLS wage release. Corrections go to contact@markstudios.com.
November 1, 2026: First published.
November 1, 2026: Corrected the order of the role medians: video production specialists ($125.94) rank above motion graphics designers and animators ($124.43).
Frequently asked questions
How much does a video editor charge per hour on a government contract?
On GSA Multiple Award Schedule contracts, video editors have a median ceiling rate of $97.47 an hour across 112 rates from 59 vendors, read November 1, 2026. The middle half run $84.97 to $120.63. Ceiling rates are maximums, and agencies can negotiate lower prices on each order.
What is a GSA ceiling rate?
It is the highest hourly price a vendor may charge the government for a labor category under its GSA Multiple Award Schedule contract. GSA calls these not-to-exceed, fully burdened rates: they include the worker's wage plus overhead, benefits and profit, and agencies can seek discounts when they place an order.
Why are GSA rates so much higher than video editor wages?
A wage is what the editor is paid; a ceiling rate is what the company bills. The $36.26 BLS median wage for film and video editors leaves out benefits, overhead, idle time and profit, which the $97.47 ceiling rate covers. The ceiling is also a maximum, not the price paid on every order.
What do videographers and animators charge on GSA contracts?
Videographers and camera operators have a median ceiling rate of $110.09 an hour (193 rates), and motion graphics designers and animators $124.43 (119 rates). Producers and directors sit at $122.94.
Can I use this data?
Yes. The CSV of all 1,598 classified rates, with role, job title, vendor, contract, hourly ceiling rate, experience, education, business size and worksite, is free to reuse under CC BY 4.0 with a link to this page. The underlying GSA data are public.