Every figure on this page links to the organization that produced it, and each was re-checked against that source before publishing. How much YouTube is watched on television screens: every month Nielsen's The Gauge has given YouTube's share of U.S. TV viewing in text, from 2021 to August 2026, with its breaks in method; what YouTube and Alphabet say about hours on TV; how much YouTube UK, Australian, New Zealand and French viewers watch on TV sets, from Ofcom, Barb, OzTAM, NZ On Air and Médiamétrie; how many homes have a connected TV; what TV viewing means for video length, podcasts and Shorts, including our own count of 20-minute-plus uploads on the biggest channels; the advertising money behind it; and where the popular YouTube-on-TV numbers came from.
YouTube took 15.8% of all U.S. TV-set viewing in August 2026, the latest month Nielsen has published, against 7.7% for Netflix. (Nielsen)See details
That is 2.0 times its 7.9% share in February 2023, the first month Nielsen counted YouTube without YouTube TV: an average gain of 0.19 points a month (our calculation). (Our calculation from Nielsen)See details
By our arithmetic on Nielsen's August 2026 figures, YouTube took about 31.9% of all streaming time on U.S. TV sets. (Our calculation from Nielsen)See details
YouTube says TV passed mobile as its main screen in the U.S. by watch time as of December 2024, and Alphabet put U.S. living-room viewing at over 200 million hours a day in April 2026. (YouTube; Alphabet)See details
In the UK, 46% of in-home YouTube viewing was on a TV set in 2025, up from 27% in 2022, and 54% for children aged 4 to 15 (Barb data via Ofcom). (Ofcom)See details
In our read of the 97 most-subscribed channels, 37.6% of the latest long-form uploads ran 20 minutes or longer: 70.8% on education channels, 5.0% on music channels. (Our read)See details
The 'over 1 billion hours a day on TV' figure is worldwide, from YouTube's February 2024 CEO letter; pages that call it a U.S. figure misread it. (YouTube; TV Technology)See details
How much U.S. TV viewing goes to YouTube?
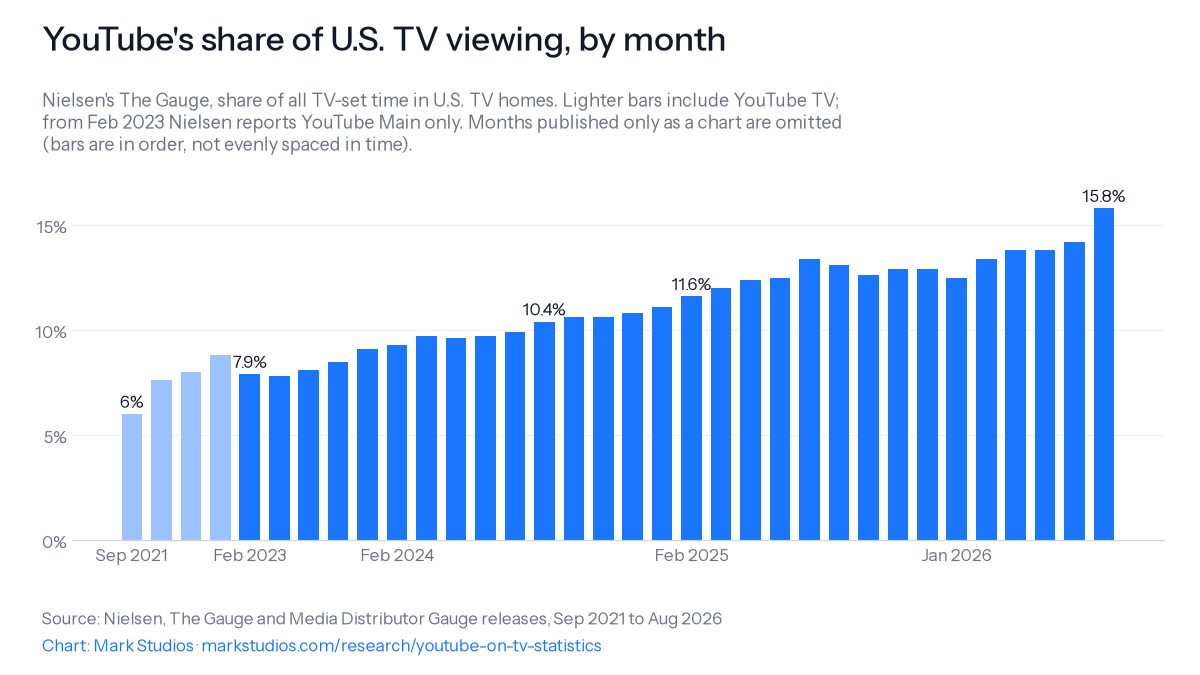
15.8% of all time spent watching TV sets in U.S. TV homes went to YouTube in August 2026 (July 27 to August 30), a record for any streaming service in Nielsen's monthly measurement, The Gauge (Nielsen). That is the latest month Nielsen has published; it says the September and October figures will come out together later in the year. In the same month streaming as a whole took 49.6% of TV time and cable 18.9% (Nielsen); Disney, the No. 2 media company, had 9.3% (Nielsen) and Netflix 7.7% (Nielsen).
Our arithmetic on Nielsen's figures: YouTube took about 31.9% of all streaming time on U.S. TV sets in August 2026 (15.8 out of 49.6), and its share was about 2.1 times Netflix's. Nielsen's own figure for February 2025 was nearly 27% of streaming time (Nielsen).
The share has doubled since Nielsen started reporting YouTube without YouTube TV. It was 7.9% in February 2023 (Nielsen), so August 2026 is 2.0 times that, a gain of 7.9 percentage points, or 0.19 points a month on average over 42 months (our calculation). In the twelve months to August 2026 alone it rose 2.7 points, from 13.1% in August 2025 (Nielsen). Nielsen says time spent with YouTube on U.S. TVs rose 53% between February 2023 and February 2025 (Nielsen), and that YouTube Main viewing on TVs grew more than 120% from 2021 to May 2025 (Nielsen).
YouTube's share of U.S. TV viewing, by monthNielsen's The Gauge, share of all TV-set time in U.S. TV homes. Lighter bars include YouTube TV; from Feb 2023 Nielsen counts YouTube Main only. Months Nielsen gave only in a chart are omitted, so bars are in order but not evenly spaced in time.
Every month for which Nielsen printed YouTube's share in the text of a release. Months where the figure appears only in a chart image are left out. Nielsen's months are broadcast months (four or five weeks ending on a Sunday).
Breaks in the series. Up to January 2023, Nielsen's YouTube figure included YouTube TV, its paid live-TV service; from February 2023 Nielsen reported "YouTube Main" only (Nielsen), which is why the share dips from 8.8% to 7.9%. Linear streaming services such as YouTube TV had been 5.3% of total TV in December 2022 (Nielsen), and YouTube TV was 11.9% of all YouTube viewing on U.S. TVs in August 2022 (Nielsen). Nielsen will also apply a one-time adjustment from the September 2026 interval to align The Gauge with its ratings data (Nielsen), so figures from then on are not directly comparable with August 2026 and earlier.
How streaming overtook cable and broadcast
Nielsen's first Gauge, for May 2021, put streaming at 26% of TV time (Nielsen). July 2022 was the first month streaming took the largest share, passing cable, with broadcast at 21.6% (Nielsen). In May 2025 streaming, at 44.8%, beat broadcast and cable combined, 44.2%, for the first time (Nielsen), and it reached 47.5% in December 2025 (Nielsen).
When YouTube became No. 1
Nielsen ranks two different things. Among streaming platforms, YouTube had been No. 1 for a 12th straight month by January 2024 (Nielsen) and for the 19th by August 2024 (Nielsen). Among media companies, in the Media Distributor Gauge Nielsen launched on May 14, 2024 (Nielsen), YouTube first took the lead in July 2024 (Nielsen), with 10.4% (Nielsen). February 2025 was the second time, at 11.6% (Nielsen). By July 2025 its lead over Disney had grown to 4.0 points (Nielsen).
Who watches YouTube on U.S. TVs
In February 2025, adults 18 to 34 made up 21.0% of YouTube's U.S. TV audience and children 2 to 11 made up 16.9%, in Nielsen's breakdown (Nielsen). The fastest growth was among people 65 and older, whose YouTube viewing on TVs rose +96% between February 2023 and February 2025 (Nielsen). In July 2024 school-age viewers, 2 to 17, were nearly 30% of YouTube's TV viewing (Nielsen). In August 2026 Nielsen credited a 9% rise in viewing among adults 50 and older (Nielsen). These are shares of YouTube's own audience, not YouTube's share of each age group's TV time, which Nielsen does not publish.
What does YouTube itself say about TV viewing?
YouTube says TV is now its main screen in the U.S. In his February 2025 letter, CEO Neal Mohan wrote that TV had surpassed mobile as the primary device for YouTube viewing in the U.S. by watch time, as of December 2024 (YouTube); YouTube has not published the percentage. These are YouTube's own internal figures, not an independent meter.
Hours on TV. Mohan's February 2024 letter said viewers worldwide watch more than 1 billion hours of YouTube on TVs every day (YouTube); the February 2025 letter repeated 1B hours, as of December 2024 (YouTube), and an October 2026 post for media companies still said over 1 billion hours on smart TVs daily (YouTube). For the U.S. alone, Sundar Pichai told investors on April 29, 2026 that viewers watch over 200 million hours of YouTube a day in the living room (Alphabet). The figure has climbed in steps: over 100 million hours a day in the living room on the Q3 2017 earnings call (Alphabet), and over 250M hours a day on TV screens worldwide in April 2019 (Google). From 2017 to 2024 that is about a tenfold rise in YouTube's own number (our calculation; both are "more than" floors).
Streaming rank. YouTube restates Nielsen's ranking in its own posts: No. 1 in U.S. streaming watch time for 11 months in February 2024 (YouTube), for two years in February 2025 (YouTube), for nearly three years in January 2026 (YouTube) and for 3 years in September 2026 (YouTube). On the Q3 2026 call Pichai called YouTube the number-one streaming platform in the U.S. by watch time (Alphabet). At Brandcast 2024 YouTube described itself as the second most-watched media distributor on U.S. TVs (YouTube), two months before it first led Nielsen's ranking.
Reach on TV. At Brandcast 2023 YouTube said it reached over 150 million people on connected TVs in the U.S. in December 2022, citing Nielsen and counting YouTube TV (YouTube). Pichai said over 45 million U.S. viewers watched election-night coverage on YouTube on November 5, 2024 (Alphabet). Google said in 2025 that YouTube had ranked No. 1 in U.S. connected-TV reach for two years, citing Comscore (Google).
Creators and formats. The number of top creators who get most of their watch time on TV rose more than 400% in the three years to early 2024 (YouTube), and in September 2026 YouTube said Over half of its top 100 creators have TV as their most-watched screen (YouTube). Viewers watched over 700 million hours of podcasts on living-room devices in October 2025, against 400 million a year earlier (YouTube); for 2024 YouTube had given over 400M hours a month (YouTube). Views of microdramas on TV rose over 90% year over year in 2026 (YouTube).
Live TV and sports. YouTube TV, the paid live-TV service, had more than 8 million subscribers in February 2024 (YouTube) and still more than 8 million a year later (YouTube); YouTube has published no newer count. YouTube's first live NFL broadcast, from Brazil in September 2025, drew more than 19 million fans (Alphabet), and NFL Sunday Ticket reached its highest paid subscriber number ever in the 2025 season, no figure given (Alphabet). Fans watch more than 40 billion hours of sports content on YouTube a year worldwide, on all screens (Alphabet).
Outside the U.S. Google said YouTube reached over 75m people aged 18 and over in India on connected TV in April 2025 (Google India). YouTube Brazil said it reached more than 80 milhões (80 million) adults on connected TV in Brazil in April 2025 (YouTube Brasil), and that its share of connected-TV audience among adults 18+ there rose from 41% to 53% in three years, citing Kantar (YouTube Brasil).
How much YouTube is watched on TV sets outside the U.S.?
In the UK, 46% of all in-home YouTube viewing was on a TV set across 2025, up from 27% in 2022, according to Ofcom's Media Nations 2026 analysis of Barb data (Ofcom): a rise of 19 percentage points in three years, or 1.7 times the 2022 share (our calculation). Ofcom's newest edition puts 2022 at 27% (Ofcom); its 2025 edition had given 29% for 2022 and 41% for 2024 (Ofcom), and its 2024 edition 34% for 2023 (Ofcom), so compare years only within one edition. Barb, the UK's TV audience measurement body, put the TV set at 43% of in-home YouTube viewing among people 16+ in the second quarter of 2025, ahead of smartphones at 32% (Barb). Barb still notes that more than half of time watching YouTube at home is on phones, computers and tablets (Barb); the 2025 figure above is just under half.
Minutes a day. UK individuals watched YouTube on a TV set for 19 minutes a day in 2025, up 111% from 9 minutes in 2022 (Ofcom). Among 16-to-34-year-olds the rise was 320%, from 5 to 21 minutes a day (Ofcom). Total in-home YouTube use on all devices was 41 minutes a day in 2025 (Ofcom). Viewing on TV sets is concentrated: a quarter of YouTube's TV-set audience accounted for 89% of its TV-set viewing in 2025 (Ofcom). The TV set took 88% of all in-home video viewing (Ofcom), and the share of video-sharing platform viewing on TV sets grew to 37% from 32% in 2024 (Ofcom).
The 2025 edition also gave daily minutes on TV sets by December 2024: 18 minutes for all individuals (Ofcom), 21 minutes for 16-to-34s (Ofcom) and 11 minutes for adults 55+ (Ofcom), with total in-home YouTube at 39 minutes (Ofcom). In its 2024 edition, viewing on TV sets went from 9 minutes a day at the start of 2022 to 15 minutes by December 2023 (Ofcom).
Longer videos. In Ofcom's 2025 survey, 67% of 18-to-24-year-olds said they had watched YouTube videos longer than 15 minutes in the past three months, and 58% of 25-to-34s (Ofcom).
Children dominate YouTube on UK TVs. Children aged 4 to 15 made up a quarter of all YouTube viewing on TV sets in 2025, though they are about one-seventh of the population (Barb); 26% of their TV switch-ons started with YouTube (Barb), and Ofcom found 20% of them go first to a video-sharing service when they turn on the TV (Ofcom). In 2024 YouTube was the most-watched service of all for children 4 to 15, with 28% of their in-home video viewing, and for 16 to 34s, with 22% (Ofcom). Across all ages it ranked second behind the BBC (Ofcom); both rankings cover every in-home screen, not only TV sets. The TV set took 84% of all in-home video viewing in 2024 (Ofcom).
Reach. In October 2023 YouTube reached 28.4m UK individuals on a TV set against 33.7 million on a smartphone (Barb); 7.3m watched it only on a TV (Barb), and its monthly reach across four screens was 51m (Barb). Barb's share of in-home YouTube on the TV set rose from 28% in December 2021 to 34% in October 2023 (Barb). Over a quarter of UK individuals watched YouTube on a TV set in an average week in 2023 (Ofcom), including 43% of children 4 to 15 (Ofcom).
Measuring it. From July 2025 Barb began reporting TV-set audiences for 200 of the most-watched YouTube channels (Barb), after a November 2024 pilot on 175 videos (Barb). The numbers are small next to broadcast: Barb's largest seven-day TV-set audience for a Sidemen YouTube video was 60k by September 2025 (Barb). Viewing of Channel 4, Sky and ITV content through YouTube was less than 1% of time with those broadcasters' channels (Barb). Barb measures through home WiFi; Ofcom notes 6% of home YouTube users never use the WiFi for it (Ofcom). Children's total identified viewing averaged 154 minutes a day across four screens from 2022 to mid-2025, but 100 minutes on the TV set (Barb). YouTube was the fourth most-used way to navigate the TV in 2025 (Barb), and in Ofcom's 2025 survey Fourteen per cent of UK viewers with nothing in mind go to YouTube first (Ofcom).
Australia, New Zealand and France
YouTube took 11.3% of all video viewing on Australian TV sets in the second quarter of 2026, in OzTAM's Streamscape measurement (OzTAM), and 20.5% of streaming minutes on TV sets in the third quarter of 2025, just behind Netflix's 21.3% (OzTAM). Digital video, including YouTube, rose from 30.1% of TV-set viewing in the first quarter of 2025 (OzTAM) to 32.6% across 2025 (OzTAM) and 39.6% in the second quarter of 2026 (OzTAM); among 18-to-39-year-olds it was 60.7% (OzTAM). TV sets carried 85.3% of Australians' in-home video minutes in late 2025 (OzTAM).
In New Zealand, almost 8 out of 10 TVs in homes were connected in 2024 (NZ On Air), and the share of people aged 15+ with access to a connected TV rose from 53% in 2023 to six in ten (NZ On Air). New Zealanders spent 97 mins a day on video-sharing platforms such as YouTube in 2026 (NZ On Air), whose daily reach of 62% was just behind total TV's 63% (NZ On Air). NZ On Air's figures come from a survey, not a meter. In France, 72% of households had a connected TV in 2025 (Médiamétrie), and on-demand and social video took 39% of daily video time (Médiamétrie).
How many homes can watch YouTube on a TV?
Nearly nine in ten U.S. TV households. 88% had at least one internet-connected TV device in 2023, up from 44% in 2013, in Leichtman Research Group's survey of 1,770 adults (Leichtman Research Group); 74% had a connected smart TV (Leichtman Research Group) and 62% a stand-alone streaming device (Leichtman Research Group). 55% of all TV sets in U.S. homes were connected smart TVs (Leichtman Research Group), and 44% of TV households had only smart TVs (Leichtman Research Group). 49% of adults watched video on a TV through a connected device every day, up from 6% in 2013 (Leichtman Research Group): 63% of those 18 to 34, 58% of those 35 to 54 and 27% of those 55 and over (Leichtman Research Group). Leichtman has not published a newer connected-TV study.
Nielsen's panel gives similar figures for 2023: 70.6% of U.S. TV homes owned a smart TV in November 2023 (Nielsen), connected devices reached 75% of people aged 2 and over in the second quarter (Nielsen), and connected-TV viewing was just under 40% of adults' TV time (Nielsen). Among 12-to-17-year-olds it was 80.2% (Nielsen). Nielsen counted 125 million U.S. TV households for the 2023-24 season (Nielsen). Comscore counted 96.4 million U.S. households streaming on connected TVs in 2025 (Comscore), using an average of 6.9 streaming services each (Comscore), and found more than half of U.S. households stream YouTube for free every month (Comscore); Comscore's release gives no sample size.
83% of U.S. adults said they watch streaming services in April 2025, while 36% subscribed to cable or satellite (Pew Research Center); 55% stream with no cable or satellite at all (Pew Research Center), and only 16% of 18-to-29-year-olds have cable or satellite, against 64% of those 65 and older (Pew Research Center). The share watching through cable or satellite had fallen from 76% in 2015 to 56% in 2021 (Pew Research Center). Traditional pay-TV subscriptions fell to 54.1 million at the end of 2023, from 61.9 million a year earlier, the FCC reports from S&P Global data (FCC). Americans 15 and older spent 2.6 hours a day watching TV in 2025, their largest leisure activity, in the American Time Use Survey, which does not separate devices (BLS).
YouTube itself reaches almost everyone: 84% of U.S. adults said they use YouTube in 2026 (Pew Research Center), 95% of 18-to-29-year-olds and 65% of those 65 and older (Pew Research Center), and 33% visit it several times a day (Pew Research Center). Pew does not ask which screen.
The platforms YouTube runs on
Roku's devices streamed 145.6 billion hours worldwide in 2025, up from 127.1 billion in 2024 (Roku), and 37.9 billion hours in the second quarter of 2026 (Roku), after 38.7 billion in the first (Roku). Roku passed 100 million streaming households worldwide in April 2026 (Roku), from 89.8 million at the end of 2024 (Roku), and says it is in more than half of U.S. broadband households (Roku). Roku counts a streaming household as an account that streamed in the last 30 days (Roku), and counts hours while a device streams, whether or not anyone is watching. Its 10-K says it has no access to the ad inventory inside the YouTube app (Roku), and that the top three services take nearly half of hours streamed on Roku (Roku). VIZIO, now owned by Walmart, had 19.1 million SmartCast accounts in its last report, for September 2024 (VIZIO), and 5.8 billion SmartCast hours that quarter (VIZIO); Walmart paid a net 1.9 billion dollars for it (Walmart).
Nielsen estimates Americans spent 16.7 trillion minutes streaming on TV in 2025, about 19% more than in 2024 (Nielsen).
Do people watch longer videos on TV?
Across streaming apps, yes: sessions on big screens run far longer than on phones. In Conviva's measurement of the streaming apps that use its software, smart TVs averaged 27 minutes per play in the fourth quarter of 2021 (Conviva), game consoles 26.5 (Conviva), desktops 14.4 (Conviva) and mobile phones 8.7 (Conviva); big screens took 83% of North American streaming time (Conviva). These are not YouTube figures, and Conviva has not published a newer device breakdown we could read. YouTube's own advice to creators, in April 2025, calls TV "prime time for longer content" such as documentaries and deep dives (YouTube), and a 2016 Google analysis found TV watch time peaks around prime time and on weekends (Google). People were 2x as likely to watch YouTube with others on a TV as on a phone or computer, in a 2016 Google/Ipsos survey (Google), when 2 out of 3 U.S. YouTube viewers aged 18 to 54 said they watched on a TV (Google).
What the biggest channels publish. In our own read of the YouTube video length study dataset, 1,076 of the 2,859 latest long-form uploads on 97 of the 100 most-subscribed channels ran 20 minutes or longer: 37.6%. For 38 of the 97 channels the median upload ran 20 minutes or more. The share varies by genre: 70.8% of uploads on education channels, 64.6% on gaming channels and 47.9% on entertainment channels ran 20 minutes or longer, against 5.0% on music channels. The dataset does not say which screen viewers used. Pew Research Center found the average video posted by channels with 250,000+ subscribers in the first week of 2019 ran roughly 12 minutes (Pew Research Center), and that YouTube's recommendations in 2018 led from videos averaging 9 minutes, 31 seconds to nearly 15 minutes by the fifth step (Pew Research Center).
Podcasts and Shorts on the TV screen
YouTube says viewers watched over 700 million hours of podcasts on living-room devices in October 2025 (YouTube), up from about 400 million in October 2024 (YouTube), and that podcasts had more than 1 billion monthly viewers on all devices in January 2025 (YouTube). Edison Research found that in the third quarter of 2025, 82% of U.S. weekly podcast consumers watched video podcasts, more than the 78% who listened to audio only (Edison Research), up from 73% watching in 2023 (Edison Research); 51% of Americans 12 and older had ever watched a video podcast in 2025 (Edison Research) and 26% in the last week (Edison Research). In the UK, the share of weekly podcast consumers who listen most often on a smart TV rose from 4% in 2023 (Edison Research) to 10% in early 2026 (Edison Research); twenty-nine percent use YouTube most for podcasts (Edison Research), and 72% actively watch video podcasts (Edison Research).
Shorts views on connected TVs more than doubled, up 100%, from January to September 2023, YouTube says (YouTube). YouTube's help pages say Shorts play on most smart TVs and consoles, but the Shorts player may not work on devices released before 2019 (YouTube Help). The earliest Internet Archive capture we found with that TV section dates from March 2023 and still mentions 2019 devices (YouTube Help, archived); a December 2022 capture has no TV section and says a Short is 60 seconds or less (YouTube Help, archived). Today the limit is 3 minutes (YouTube Help). TechCrunch reported in May 2026 that viewers watch over 2 billion hours of Shorts on TVs a month, a figure YouTube gave the publication (TechCrunch).
What YouTube changed for creators on TV
YouTube Studio's Device type report shows each channel's watch time by mobile, computer, TV and tablet (YouTube Help), and the Analytics API reports a tv device type (Google for Developers). In October 2025 YouTube raised the thumbnail size limit to 50mb for 4K TV screens (YouTube) and said it would upscale videos uploaded below 1080p for TVs (YouTube). The number of channels earning six figures or more from TV screens rose more than 45% in the year to June 2025 (YouTube). Ads on connected TVs show a QR code after 5 seconds in some formats (Google Ads Help), and Mohan named qr codes and pause ads as formats that work on TV (YouTube). YouTube says creator Kinigra Deon had over 70% of her views from connected TVs in 2023 (YouTube), and HopeScope saw a 172% rise in TV watch time (YouTube).
How big is the money behind YouTube on TV?
YouTube's ads revenue was 40,367 million dollars in 2025, on all screens, according to Alphabet's 10-K (Alphabet), up from 36,147 million in 2024 (Alphabet), 31,510 million in 2023 (Alphabet), 29,243 million in 2022 (Alphabet) and 28,845 million in 2021 (Alphabet): 39.9% growth in four years (our calculation). In the third quarter of 2026 it was 11,207 million, against 10,261 million a year earlier (Alphabet), and 32,145 million for the first nine months (Alphabet). Alphabet credited the Q3 2026 gain of $946 million first to brand advertising (Alphabet). Pichai said YouTube's ads and subscriptions together passed $60 billion in 2025 (Alphabet), after passing $50 billion over the four quarters to Q3 2024 (Alphabet). Alphabet does not split out TV revenue, and YouTube's subscription revenue, including YouTube TV and NFL Sunday Ticket, sits inside a wider line (Alphabet) that was 48,030 million dollars in 2025 (Alphabet). YouTube Music and Premium passed 150 million subscribers, including trials, in October 2026 (Alphabet), from 125 million in April 2025 (Alphabet).
At Brandcast 2023 YouTube said YouTube Select, its package of top channels for advertisers, landed over 70% of its impressions on TV screens (YouTube). Citing Nielsen, YouTube said it took over 52% of U.S. adults' ad-supported streaming time on connected TVs in October 2022 (YouTube).
Ad-supported TV took 71.5% of all U.S. TV viewing in the second quarter of 2026, in Nielsen's Ad Supported Gauge (Nielsen), after a 2025 high of 74.2% in the fourth quarter (Nielsen); streaming was 48.2% of ad-supported viewing (Nielsen). Adults 18 to 49 spent 63.8% of their TV time with ad-supported TV (Nielsen), and 81.1% of their streaming on ad-supported tiers of services such as YouTube (Nielsen). Comscore found 45% of Netflix's U.S. household viewing hours were on its ad tier in 2025 (Comscore).
IAB, which represents ad sellers, estimated U.S. connected-TV ad spend at 23.6B dollars in 2024 (IAB) and projects 29.3 billion for 2026 (IAB); its September 2026 update expects CTV spend to grow 15.6% in 2026 (IAB). All U.S. digital video, including YouTube and social video, should pass 80B dollars in 2026 (IAB), and social video passed CTV in 2025 (IAB). In IAB's 2026 buyer survey, 43% of video ad buyers had little or no confidence in inventory quality even for their most trusted CTV buying methods (IAB).
What the popular YouTube-on-TV numbers really say
A handful of YouTube-on-TV statistics circulate through ad-tech blogs, creator newsletters and agency pitches. We traced each to the organization that produced it.
"YouTube is the No. 1 TV channel in America"
Nielsen ranks media companies, not channels. Cord Cutters News called YouTube "the most-watched TV provider in the United States for 2025" (Cord Cutters News), quoting a Nielsen year-to-date average of about 11.8% (Cord Cutters News). The ranking behind it is Nielsen's Media Distributor Gauge, which adds up each company's broadcast, cable and streaming viewing (Nielsen). YouTube first topped it in July 2024 with 10.4%, and in the latest published month, August 2026, it held 15.8% (Nielsen). Use instead: "YouTube had the largest share of U.S. TV-set viewing of any media company in Nielsen's Media Distributor Gauge, 15.8% in August 2026."
"Over 1 billion hours of YouTube are watched on TV every day in the U.S."
The billion is worldwide, and the first billion was not about TV at all. YouTube's February 2017 milestone, a billion hours a day, counted every device (YouTube). Tubefilter reported in 2021 that one billion hours a day were watched on TV screens, then corrected itself: the figure was all watch time (Tubefilter). The TV-only version first appears in Neal Mohan's February 2024 letter, "more than 1 billion hours" a day on TVs, globally (YouTube), repeated in February 2025 as 1B hours with no geography (YouTube). TV Technology then wrote that more than 1 billion hours a day are viewed "on TV sets in the U.S." (TV Technology), and Adwave repeated 1 billion hours on "U.S. TV screens" (Adwave). Mohan's January 2026 letter dropped the daily figure and cited Nielsen's nearly three years at No. 1 instead (YouTube). The often-quoted "450 million hours a day" from 2020 was Tubefilter's own arithmetic on an 80% growth figure: 450 million hours (Tubefilter). The last official step before it was 250M hours a day globally in April 2019 (Google). Use instead: worldwide, more than 1 billion hours a day (YouTube, 2024); U.S., over 200 million hours a day in the living room (Alphabet, April 2026).
"People watch twice as long on TV"
From one multi-channel network's own catalogue. Tubefilter reported in 2019 that Collab, a YouTube multi-channel network that sells ads on its creators' videos, found watch time doubled on TV screens compared with mobile in 2018, across its own channels (Tubefilter). YouGov later relayed Collab's 2020 figures: an average view of 7.26 minutes on connected TVs against 3.61 on mobile (YouGov). We found no YouTube, Nielsen or Comscore measurement of view length by device. Google's own TV figure is narrower: fewer, longer ad breaks give viewers 50% longer sessions, in Google data from July 2024, before the next break (Google Ads Help). Use instead: Conviva's cross-app figure of 27 minutes per play on smart TVs against 8.7 on phones (Q4 2021), named as Conviva's.
"Half of YouTube's U.S. watch time is on TV"
The "half" counts people, not time. eMarketer estimated that 52.8% of U.S. YouTube viewers watched on connected TVs in 2020 (eMarketer), a share of viewers. Estimates of watch time are lower: 34.4% in Q3 2020 from Collab's data (eMarketer), 36.4% for 2022 in an eMarketer forecast (Tubefilter), and 36% of U.S. viewer hours in the first half of 2025 in Digital i's panel, as reported by Señal News (Señal News). Adwave's 2026 "over 44%", credited to "eMarketer, via TechCrunch", has no original we could find (Adwave). YouTube's own claim is that TV is the primary device in the U.S. by watch time, as of December 2024, with no percentage (YouTube). Use instead: that sentence, or Nielsen's share of all TV time.
"150 million Americans watch YouTube on TV every month"
A 2023 figure presented as current. YouTube said in October 2023 that over 150M people watch YouTube on connected TVs each month (YouTube), the figure it first gave at Brandcast in May 2023 for December 2022, including YouTube TV, as Tubefilter reported: 150 million (Tubefilter). Adwave in September 2025 presented 150 million Americans as current, sourced to an Indian news site (Adwave). Use instead: "over 150 million people in the U.S. on connected TVs, December 2022 (YouTube, citing Nielsen)", dated.
YouTube's share, quoted for the wrong month
Nielsen's figure moves every month, so an old one ages fast. On September 1, 2025, Adwave said YouTube "now captures 11.6%" of TV viewing (Adwave), February 2025's figure; Nielsen had published 13.4% for July 2025 on August 26 (Nielsen). The same 13.4% recurred in April 2026, 13.4% (Nielsen), so a bare "13.4%" can mean either month. Use instead: always print the broadcast month; the table above lists every month Nielsen gave in text.
"TV is YouTube's fastest-growing screen"
A company line since at least 2016, rarely with a number. Think with Google UK said in December 2016 that TV was the fastest growing screen for YouTube watch time in the UK, more than doubling (Google), Mohan said in 2018 that TV viewing in the EU grew 45% year on year (Digital TV Europe), and in September 2024 he called TV the fastest-growing screen with no figure (eNCA (AFP)). Use instead: Nielsen's measured growth, time spent with YouTube on U.S. TVs up 53% from February 2023 to February 2025 (Nielsen), with viewing among adults 65+ up 96% (Nielsen); or Ofcom's UK TV-set share, 27% of in-home YouTube in 2022 to 46% in 2025.
We started from the questions people search for about youtube on tv statistics and looked for the organization that actually produced each answer. Every figure on this page sits in an evidence ledger with its source, the exact table or paragraph it came from, the measurement period, the population measured, and the date we checked it. This edition holds 299 figures from 28 publishers.
On November 1, 2026, each of the sourced figures on this page was re-fetched with the fetch cache cleared and matched against the recorded wording: Nielsen's Gauge, Media Distributor Gauge and Ad Supported Gauge releases and insights, YouTube's official blog and CEO letters, Alphabet's 10-K, 10-Q and earnings remarks, YouTube Help and Google Ads Help pages, Ofcom's Media Nations reports (2024, 2025 and 2026 editions), Barb, OzTAM, NZ On Air, Médiamétrie, Roku, VIZIO and Walmart filings, Leichtman Research Group, Pew Research Center, Comscore, IAB, the FCC, the BLS American Time Use Survey, Edison Research, Conviva, and the pages behind each popular claim. Ofcom, some Barb insight articles, the BLS and several older Google pages refuse scripts or have moved, so those rows were read through Internet Archive captures. Our own length figures come from the published dataset of our YouTube video length study. We left out Nielsen months that appear only in chart images, Barb's gated 2025 viewing report, Edison Research and Conviva pages that refuse scripts, and a YouTube statement on Shorts hours on TV that we found only in press coverage, except where the page names the publication that reported it.
We only cite the producer: government agencies, regulators, company filings and official posts, and the survey owner's own report. We do not cite statistics roundups, Statista-style aggregators, or salary sites without a public method. We did not bypass paywalls or sign-up forms; where a full report was gated, we used only the figures its publisher states publicly.
Figures marked "our calculation" are arithmetic on the cited numbers, and anyone can reproduce them:
This edition contains no Mark Studios customer data.
Limitations
Meters count different things. Nielsen measures YouTube's share of all TV-set time in U.S. TV homes; Barb and Ofcom measure in-home YouTube viewing over home WiFi in the UK; OzTAM measures video on Australian TV sets; YouTube's own hours are its internal logs. The figures are not comparable across countries or sources.
Nielsen's series has breaks. YouTube TV is included up to January 2023 and excluded from February 2023, Nielsen changed how it allocates some viewing in September 2022 and June 2023, and a one-time adjustment applies from September 2026. Several months appear only in charts and are missing from our table.
YouTube's statements are self-reported. Hours on TV, creator counts and podcast hours come from YouTube with no published method, and several are 'more than' floors repeated for years.
Several sources sell into the market. Roku, VIZIO, Comscore, Conviva and Collab sell streaming, data or advertising services, and IAB represents ad sellers.
Our length count does not measure screens. It counts how long the 97 biggest channels' latest long-form uploads run, not where they were watched, and the most-subscribed channels are not typical.
Some figures are old. The newest connected-TV household surveys we could read are from 2023, and the newest Conviva device breakdown from 2021.
How to cite this page
For a single figure, cite the original publisher named next to it, and link here if the verification trail is useful to your readers. Each figure has its own anchor, so you can link straight to it, for example https://www.markstudios.com/research/youtube-on-tv-statistics#DRV-001. To cite the page as a whole:
Mark Studios. "YouTube on TV Statistics." Last verified Nov 1, 2026. https://www.markstudios.com/research/youtube-on-tv-statistics
APA
Mark Studios. (2026, November 1). YouTube on TV statistics. https://www.markstudios.com/research/youtube-on-tv-statistics
MLA
“YouTube on TV Statistics.” Mark Studios, 1 Nov. 2026, www.markstudios.com/research/youtube-on-tv-statistics.
Chicago
Mark Studios. “YouTube on TV Statistics.” Last modified November 1, 2026. https://www.markstudios.com/research/youtube-on-tv-statistics.
BibTeX
@misc{markstudios_youtube_on_tv_statistics_2026,
  author = {{Mark Studios}},
  title = {{YouTube on TV Statistics}},
  year = {2026},
  month = nov,
  url = {https://www.markstudios.com/research/youtube-on-tv-statistics},
  note = {Last verified 2026-11-01}
}
Our calculations and the evidence table are free to reuse with attribution and a link to this page. Each underlying figure remains the claim of its original publisher, and some publishers ask for a link when their figures are reused.
We re-verify every figure quarterly and when a major source publishes a new edition. The next scheduled review is February 2027. Corrections go to contact@markstudios.com.
Nov 1, 2026: First published with 299 figures from 28 publishers, each checked against its original source.
Frequently asked questions
How much of U.S. TV viewing is YouTube?
15.8% in August 2026, the latest month in Nielsen's The Gauge, a record for any streaming service and more than any media company, including Disney at 9.3%.
How fast is YouTube growing on TV?
Its share of U.S. TV grew 2.0 times, from 7.9% in February 2023 to 15.8% in August 2026, by our calculation on Nielsen's figures, and rose 2.7 points in the latest year.
How many hours of YouTube are watched on TV each day?
Worldwide, more than 1 billion hours a day, YouTube said in February 2024. In the U.S., over 200 million hours a day in the living room, Alphabet said in April 2026.
Is TV the main screen for YouTube?
In the U.S., yes, according to YouTube, which said TV had surpassed mobile by watch time as of December 2024. In the UK, the TV set took 46% of in-home YouTube viewing in 2025.
Do people watch longer videos on TV?
Streaming sessions are longer on big screens: Conviva measured 27 minutes per play on smart TVs against 8.7 on phones in late 2021, across the apps it measures. No YouTube or Nielsen figure measures view length by device.
Are people watching podcasts on TV?
Yes. YouTube says viewers watched over 700 million hours of podcasts on living-room devices in October 2025, up from about 400 million a year earlier.
Is YouTube the No. 1 TV channel?
Not as a channel. Nielsen ranks media companies, and YouTube has led that ranking, the Media Distributor Gauge, in most months since July 2024, when it first took the lead with 10.4%.