Where do video editors earn the most, and where does that pay go furthest? We combined the Bureau of Labor Statistics' May 2025 state pay estimates for film and video editors with the Bureau of Economic Analysis's regional price parities.
Film and video editors earn the most in New York, a median $103,440 a year, followed by the District of Columbia ($98,830) and Massachusetts ($92,130). See details
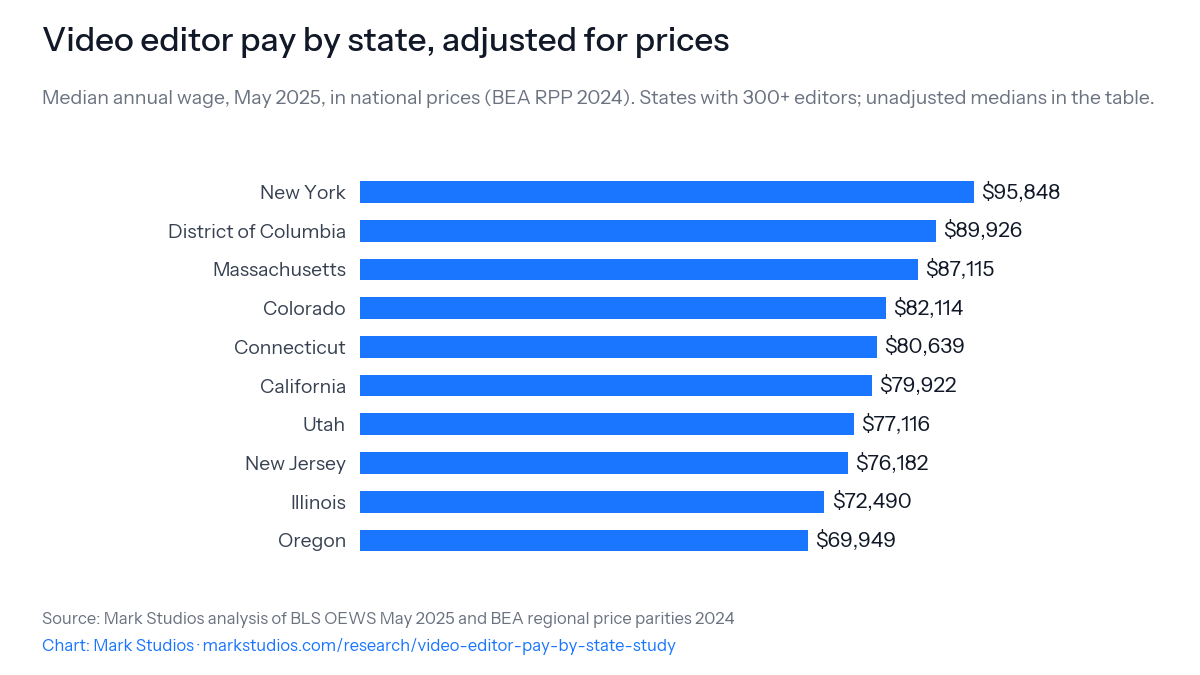
Adjusted for local prices with the BEA's regional price parities, New York still leads among states with 300 or more editors, at $95,848 in national prices; Missouri climbs from 17th to 12th and Washington falls from 11th to 16th. See details
California employs 8,110 film and video editors and New York 3,710; with Florida, they hold 56.3% of editors in the states BLS reports. See details
Editors are 2.7 times as concentrated in California's workforce as in the nation's, and 2.33 times in New York's. See details
Los Angeles is the largest metro market, with 6,010 editors at a median $83,210; New York-Newark-Jersey City has 3,430 at $104,590. See details
Which state pays video editors the most?
The Bureau of Labor Statistics publishes pay estimates for film and video editors (occupation 27-4032) in 43 states and territories (BLS OEWS). In May 2025 the highest median was in New York, at $103,440 a year, followed by the District of Columbia ($98,830), Massachusetts ($92,130) and California ($88,490). The lowest published medians were in Alaska ($38,800) and South Dakota ($39,090).
Every state with a published estimate
State
Editors employed
Median annual pay
Location quotient
Price parity (2024)
Median in national prices
New York
3,710
$103,440
2.33
107.921
$95,848
District of Columbia
370
$98,830
3.18
109.901
$89,926
Massachusetts
550
$92,130
0.92
105.757
$87,115
California
8,110
$88,490
2.7
110.72
$79,922
Colorado
380
$84,620
0.81
103.052
$82,114
Connecticut
600
$83,550
2.15
103.61
$80,639
New Jersey
620
$82,890
0.88
108.805
$76,182
Virginia
0
$78,740
–
101.104
$77,880
Maryland
250
$78,380
0.54
104.959
$74,677
Utah
370
$76,240
1.29
98.864
$77,116
Alabama
120
$74,410
0.36
88.823
$83,773
Illinois
310
$72,460
0.3
99.958
$72,490
Oregon
360
$72,300
1.11
103.361
$69,949
Louisiana
80
$66,870
0.25
88.207
$75,810
Washington
450
$66,870
0.77
107.013
$62,488
Nevada
320
$65,720
1.24
99.979
$65,734
Vermont
100
$63,080
2.08
97.958
$64,395
Kentucky
60
$62,330
0.18
90.159
$69,133
New Hampshire
100
$61,250
0.89
104.165
$58,801
Texas
1,040
$61,220
0.45
97.057
$63,076
Florida
1,490
$60,430
0.91
103.414
$58,435
North Carolina
400
$60,020
0.49
94.326
$63,630
Michigan
360
$59,100
0.5
96.217
$61,424
Missouri
380
$57,950
0.79
90.817
$63,810
Tennessee
560
$57,880
1.03
91.87
$63,002
Ohio
340
$56,410
0.37
92.774
$60,804
Nebraska
120
$55,810
0.69
90.103
$61,940
Oklahoma
100
$55,210
0.37
87.843
$62,851
Idaho
100
$54,080
0.67
95.494
$56,632
Wisconsin
240
$53,430
0.5
94.095
$56,783
Minnesota
200
$53,150
0.4
98.621
$53,893
Georgia
0
$51,280
–
96.293
$53,254
Kansas
70
$50,900
0.31
90.068
$56,513
Mississippi
50
$50,410
0.24
86.953
$57,974
New Mexico
160
$49,400
1.12
92.212
$53,572
Arkansas
80
$48,480
0.36
86.937
$55,765
West Virginia
30
$48,440
0.29
89.497
$54,125
Indiana
450
$46,780
0.86
93.329
$50,124
Arizona
350
$45,840
0.66
100.677
$45,532
Puerto Rico
110
$44,490
0.72
–
–
Montana
110
$42,520
1.35
94.645
$44,926
South Dakota
30
$39,090
0.44
88.586
$44,127
Alaska
30
$38,800
0.57
102.359
$37,906
Where does editor pay go furthest?
High-paying states are also expensive. Dividing each median by the state's regional price parity, the BEA's measure of how prices compare with the national average (BEA), puts pay in national prices. Among the 21 states with 300 or more editors, New York still leads at $95,848. Missouri gains the most, from 17th to 12th, and Washington loses the most, from 11th to 16th.
Video editor pay by state, adjusted for pricesMedian annual wage, May 2025, in national prices (BEA RPP 2024). States with 300+ editors; unadjusted medians in the table.Use this chart on your site
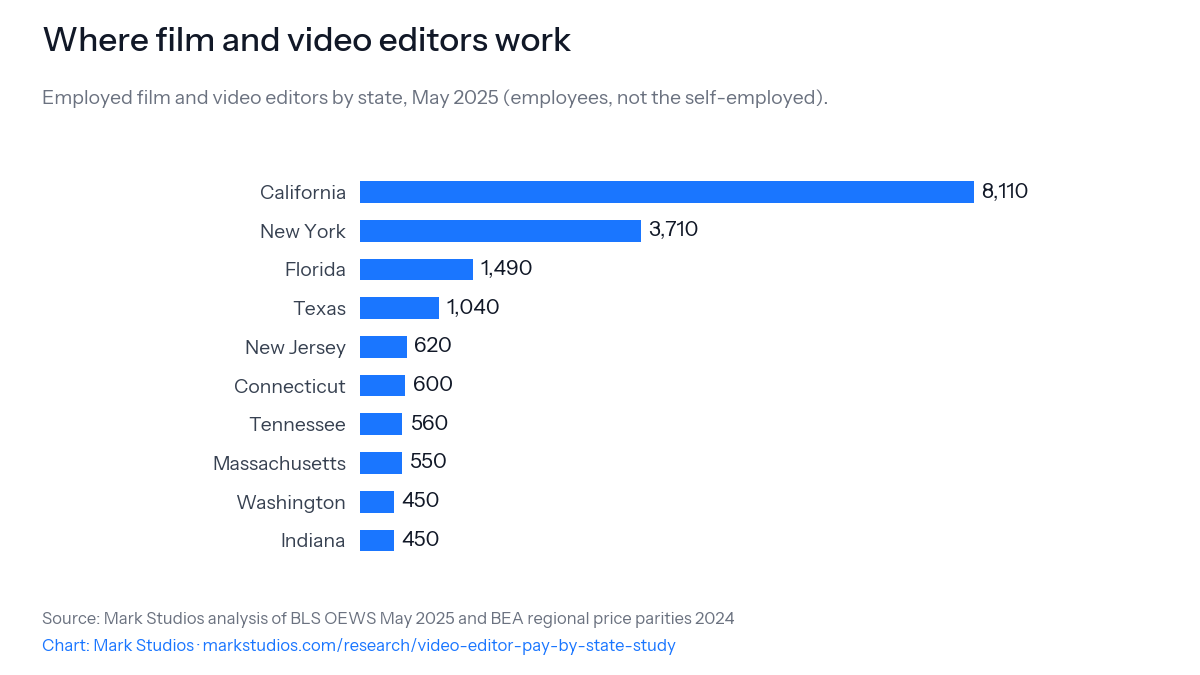
California employs 8,110 film and video editors and New York 3,710. With Florida (1,490), they hold 56.3% of the editors in the states BLS reports. The location quotient compares each state's share of editors with the national share: editors are 2.7 times as concentrated in California and 2.33 times in New York.
Where film and video editors workEmployed film and video editors by state, May 2025 (employees, not the self-employed).Use this chart on your site
Los Angeles-Long Beach-Anaheim has 6,010 film and video editors at a median $83,210, the largest market. New York-Newark-Jersey City, NY-NJ follows with 3,430 at $104,590, then San Francisco-Oakland-Fremont, CA with 740 at $109,930.
The 12 metro areas with the most film and video editors
Metro area
Editors employed
Median annual pay
Los Angeles-Long Beach-Anaheim, CA
6,010
$83,210
New York-Newark-Jersey City, NY-NJ
3,430
$104,590
San Francisco-Oakland-Fremont, CA
740
$109,930
Washington-Arlington-Alexandria, DC-VA-MD-WV
560
$91,750
Boston-Cambridge-Newton, MA-NH
430
$88,910
Orlando-Kissimmee-Sanford, FL
390
$60,470
Miami-Fort Lauderdale-West Palm Beach, FL
360
$61,950
Dallas-Fort Worth-Arlington, TX
350
$65,000
Nashville-Davidson--Murfreesboro--Franklin, TN
300
$59,280
Phoenix-Mesa-Chandler, AZ
290
$45,750
Las Vegas-Henderson-North Las Vegas, NV
280
$65,830
Seattle-Tacoma-Bellevue, WA
280
$75,420
What this means
The money and the jobs sit in the same few places. California and New York hold most editing jobs and the highest pay.
Prices narrow the gap. After the price adjustment, coastal medians shrink, but New York still leads.
Remote work blurs the map. These are employees counted where they work; freelancers are not in them.
Pay and jobs. BLS Occupational Employment and Wage Statistics for May 2025 (time-series files): state and metro estimates of employment, mean and median annual pay and location quotient for film and video editors (27-4032), read November 1, 2026. BLS withholds estimates that do not meet its publication standards, so some states are missing.
Prices. The BEA's regional price parities for all items by state, 2024 (SARPP), where the national average is 100. A state's median in national prices is its median divided by its parity over 100. The District of Columbia is treated as a state; Puerto Rico has no parity and is left out of the price ranking.
Limitations
Employees only. OEWS excludes the self-employed, a large part of the editing workforce.
Small states are noisy. Where few editors are employed, a median can move a lot between surveys, which is why the price ranking uses states with 300 or more.
Different years. Pay is for May 2025 and price parities for 2024.
Price parities are state averages. Prices inside a state, such as Manhattan against upstate New York, differ.
We plan to update the page each spring, when BLS publishes the next OEWS estimates. Corrections go to contact@markstudios.com.
November 1, 2026: First published.
Frequently asked questions
Which state pays video editors the most?
New York. In May 2025 its film and video editors earned a median $103,440 a year, according to the Bureau of Labor Statistics, ahead of the District of Columbia ($98,830) and Massachusetts ($92,130), among the states where BLS publishes an estimate.
Where do video editors earn the most after cost of living?
Among states with 300 or more film and video editors, New York leads at $95,848 in national prices, using the BEA's 2024 regional price parities, followed by the District of Columbia ($89,926) and Massachusetts ($87,115).
Which state has the most video editors?
California, with 8,110 employed film and video editors in May 2025, then New York with 3,710 and Florida with 1,490. The counts cover employees, not the self-employed, so freelance editors working from home are not in them.
How much do video editors make in Los Angeles?
Film and video editors in the Los Angeles-Long Beach-Anaheim metro area earned a median $83,210 a year in May 2025, across 6,010 employees, the largest editing workforce of any metro area.
Can I use this data?
Yes. The CSV of every state with a published estimate, with employment, median and mean pay, location quotient, price parity and price-adjusted median, is free to reuse under CC BY 4.0 with a link to this page.