Every figure on this page links to the organization that produced it, and each was re-checked against that source before publishing. What the NFL, NBA, MLB, NHL and MLS teams post on YouTube (our own measurement), how many people watch sports on TV and streaming, how much sports video the platforms and leagues report, who pays for it, how big the U.S. sports industry is, who plays, and where the popular sports video numbers came from.
Shorts were 52.7% of the median team channel's YouTube uploads in our read of 149 NFL, NBA, MLB, NHL and MLS team channels over the 180 days to October 30, 2026. (Our measurement)See details
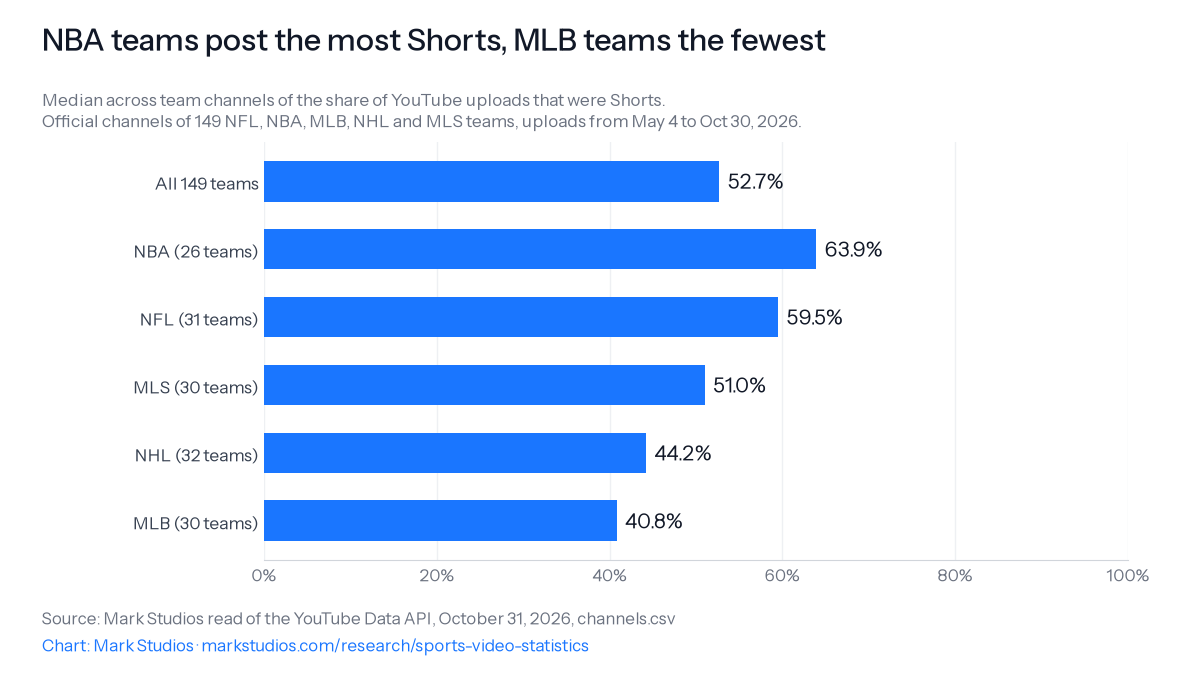
NBA teams leaned on Shorts most, at 63.9% of the median team's uploads, and MLB teams least, at 40.8%. (Our measurement)See details
On 117 of the 144 team channels that posted Shorts, the typical Short out-drew the typical long video, yet only 6.5% of the teams' long videos had chapters and 5.8% had team-uploaded captions. (Our measurement)See details
Super Bowl LX drew an estimated 125.6 million U.S. viewers in February 2026, the second-largest Super Bowl audience after Super Bowl LIX's 127.7 million in 2025. (Nielsen)See details
Streamed NFL games now draw broadcast-sized audiences: Amazon's January 2026 Wild Card game reached 31.6 million viewers, and Netflix's Lions-Vikings Christmas game averaged 27.5 million U.S. viewers. (Amazon; Netflix)See details
YouTube's own figure for sports watching rose from more than 35 billion hours a year in February 2025 to 45 billion in July 2026. (YouTube)See details
NFL-related videos drew more than 20 billion YouTube views in 2025, and uploads of NFL videos grew more than 400% from 2020 to 2025. (YouTube Culture & Trends)See details
31% of U.S. adults named football their favorite sport to watch in August 2026, the lowest since 2001; among adults 18 to 34 it was 20%. (Gallup)See details
Media rights, production and content brought TKO, owner of UFC, WWE and IMG, about $2.6 billion in 2025, and Disney's domestic ESPN business had $16,085 million of revenue in fiscal 2025. (Company filings)See details
Only 270 of the 25,610 U.S. wage-and-salary film and video editors worked for spectator sports employers in May 2025. (BLS)See details
A record 8,266,244 participants played U.S. high school sports in 2024-25, and a record 48.1 million Americans played golf in 2025. (NFHS; National Golf Foundation)See details
The popular '70% of fans watch on mobile' is a streaming figure: 70% of U.S. sports viewers use a streaming service to watch sports. Google's own mobile figure was 30% of fans in 2017. (Parks Associates; Google)See details
What do pro sports teams post on YouTube?
Mostly Shorts, and a lot of them. In the 180 days to October 30, 2026, Shorts made up 52.7% of the median team channel's uploads in our read of 149 official YouTube channels of NFL, NBA, MLB, NHL and MLS teams, and 53.1% of all 55,881 uploads pooled. Shorts drew 66.8% of the views on those uploads. We took each team's channel from Wikidata or, where Wikidata had none, from the team's official website, and read every upload through the YouTube Data API on October 31, 2026. Five teams had no channel we could identify that way and are left out. The per-channel and per-video data is published in channels.csv and videos.csv.
NBA teams post the most Shorts, MLB teams the fewestMedian across team channels of the share of YouTube uploads that were Shorts. Official channels of 149 NFL, NBA, MLB, NHL and MLS teams, uploads from May 4 to Oct 30, 2026.
The leagues differ. Shorts were 63.9% of the median NBA team's uploads, the highest, followed by the NFL at 59.5%, MLS at 51.0%, the NHL at 44.2% and MLB at 40.8%, the lowest. 144 of the 149 teams posted at least one Short; the five that posted none were four MLB teams and one MLS club. The window covered different parts of each season (the NBA and NHL playoffs and off-season, the NFL off-season and first eight weeks, most of the MLB season and postseason, and an MLS season broken by the World Cup), so cadence and format partly follow the calendar.
Median team channel
All
NFL
NBA
MLB
NHL
MLS
Uploads per week
11.6
24.3
9.5
7.6
8.1
9.5
Typical regular video (minutes)
7.9
9.5
5.5
11.0
6.4
6.3
Views on the typical Short
8,536
16,102
10,456
16,724
5,696
1,796
Subscribers when read
109,000
337,000
191,500
74,350
66,150
29,050
Teams: 149 in all, 31 NFL, 26 NBA, 30 MLB, 32 NHL and 30 MLS. "Typical" is each channel's median over uploads at least 7 days old; the table gives the median of those across teams.
Shorts usually out-draw the team's own long videos. On 117 of the 144 channels that posted Shorts, the typical Short had more views than the typical regular video: for the median team, 8,536 views against 4,893. Relative to regular videos, the gap is widest in MLS, 1,796 views against 469, and smallest in MLB, 16,724 against 15,752. The median team Short ran 26 seconds. Long videos earn fewer likes per view: 21.0 likes per 1,000 views on the median team's regular videos against 38.6 on its Shorts, and by league the regular-video median runs from 19.0 in the NBA to 24.7 in MLS.
Few teams use YouTube's long-video tools. Only 6.5% of the teams' regular videos had chapters, and 5.8% had captions the team uploaded rather than YouTube's automatic ones; the median team was at 0.6%. 4.0% of uploads carried YouTube's paid-promotion label, almost all of them on NFL team channels. The five league channels are a different scale: they posted a median of 140.4 videos a week, about 12 times the median team, and are kept out of the team medians.
How many people watch live sports on TV?
More than any other kind of television. An estimated 125.6 million U.S. viewers watched Super Bowl LX on February 8, 2026, the second-largest Super Bowl audience on record, per Nielsen. The year before, Super Bowl LIX averaged 127.7 million, the record, up 3.2% on Super Bowl LVIII's 123,714,000 in 2024. Super Bowl LX peaked at 137.8 million in the second quarter, and the halftime show averaged 128.2 millionNielsen. For scale, Super Bowl I in 1967 drew 26,750,000 on CBS, plus another audience on NBC Nielsen's historical table.
Two cautions apply to these totals. Nielsen measured Super Bowl LX and the 2026 NBA Finals with its Big Data + Panel method for the first time, so part of any rise reflects the new method. And reach is not audience: Nielsen first said 191.1 million people saw at least one minute of Super Bowl LIX, then revised that to 171.8 millionNielsen. Neither reach figure is comparable with the 127.7 million average audience.
Football drives the whole TV calendar. NFL and college football tripled sports' share of U.S. broadcast viewing to 33% in September 2025, from 11% in August Nielsen, The Gauge. The AFC Championship game on January 26, 2025 drew 57.4 million, the biggest audience of that month Nielsen. In December 2025 cable sports programming made up 9% of all U.S. cable viewing, with NFL games the top five cable telecasts Nielsen.
Several of these were records or near-records. The 2026 NBA Finals average was the highest since 1998 and double 2025's. The 2026 World Cup averaged 7,737,000 U.S. viewers across 104 matches on FOX, FS1 and Tubi, more than double Qatar 2022 FOX Sports. The seven-game 2025 World Series averaged 15,709,000 on FOX FOX Sports, while MLB's own count, which adds Univision and the apps, is 16.1 millionMLB.com; counting Canada and Japan, MLB put Game 7 at 51.0 millionMLB.com. The 2025 MLB postseason generated 58.2 billion U.S. viewing minutes, up 24% Nielsen. The 2026 NCAA men's tournament averaged 10.9 million viewers, up 7% NCAA.com, and its content drew nearly 4 billion views on social platforms.
How fast is women's sports viewing growing?
Fast, from a smaller base. Nielsen counted 46 billion minutes of women's sports viewing in the U.S. in 2025 Nielsen. In 2024 the NCAA women's final outdrew the men's for the first time: 18.9 million against 14.8 millionNielsen. Before 2023 the highest final in Nielsen's women's table, which starts in 1995, was that year's 7,444,000Nielsen. The NWSL had 39.3 million U.S. fans in 2025, up from 30.8 million in 2023 Nielsen fan survey, no sample size published, and its 2025 final averaged a record 1.18 million on CBS Nielsen. ESPN networks averaged 1.3M viewers across 25 WNBA regular-season games in 2025 Nielsen. The 2025 US Open women's final averaged 2.4 million, up 50% Nielsen, and the 2026 Olympic women's hockey gold-medal game averaged 5.3 million across USA Network and Peacock Nielsen.
Audiences also differ by sport. Black viewers made up 31.7% of the 2025 NBA postseason audience, the highest share among the major U.S. sports Nielsen. Only 27% of Americans call themselves soccer fans, against a world average of 51% Nielsen fan survey. PGA Tour viewership rose 10% in 2025 Nielsen. Streaming sports documentaries reached 16,937 million viewing minutes in 2024, up from 4,709 million in 2021 Nielsen.
How many Americans are sports fans?
Fewer than four in ten follow sports even somewhat closely, and the rest barely do. In August 2023, 62% of U.S. adults said they follow professional or college sports not too closely or not at all, and 16% follow them extremely or very closely Pew Research Center, n=11,945. 39% follow no sport at all, and 7% are "superfans" who follow sports very closely and talk about them daily Pew. Asked to name "America's sport", 53% chose football, about twice the share for baseball Pew. In July and August 2025, 22% of adults said they had bet on sports in the past year Pew, n=9,916.
Football's lead is shrinking. In Gallup's August 2026 poll, 31% of U.S. adults named football their favorite sport to watch, down from 41% in December 2023 and the lowest since 2001 Gallup, n=1,200. Soccer reached 9%, Gallup's highest reading for it, and 20% named no favorite sport Gallup. Among adults 18 to 34, only 20% picked football, against 38% of those 55 and older Gallup. In 1948 baseball led at 39%Gallup trend.
In the UK, 85% of broadcast sport was watched live in 2025 Ofcom Media Nations 2026. England's 2026 World Cup semi-final peaked at 21.5 million on TV sets Ofcom. Broadcaster viewing of sport fell 21 hours per person from 2024 to 2025, mostly because 2024 had Euro 2024 and the Paris Olympics Ofcom.
How big are streamed sports audiences?
Streamed NFL games now draw broadcast-sized audiences. Amazon says its January 2026 Wild Card game on Prime Video reached 31.6 million viewers, which it calls the most-streamed NFL game ever Amazon Ads. Netflix had claimed that record for Lions-Vikings on Christmas Day 2025, at 27.5 million U.S. viewers per Nielsen Netflix; Cowboys-Commanders that day averaged 19.9 million Netflix. The two claims are not in conflict: the record changed hands.
Christmas Day 2025, with back-to-back NFL games on Netflix and a late game on Prime Video, set a U.S. single-day streaming record of 55.1 billion viewing minutes on TV sets Nielsen, and Netflix and Prime Video together took 22.5% of all TV use that day Nielsen. A single Prime Video Wild Card stream on January 11, 2025 helped drive 47 billion streaming minutes Nielsen.
YouTube first reported its first exclusive NFL game at 17.3 million and corrected it four days later to 19.7 million, of which 18.5 million were in the U.S.; much press still repeats the first figure. Peacock's simulcast was more than 20% of the Super Bowl LX audience, and 73% of Peacock's Super Bowl viewers were under 50, against 54% of the total audience Nielsen.
Streaming also brings a younger audience. Amazon reports a median Thursday Night Football viewer age of 49.4 in 2025, against 56.2 for NFL games on linear networks, and 122.09 million unique viewers across the season, up from 71.97 million in 2022 Amazon Ads. TNF viewership rose 16% over 2024 Amazon Ads. MLS says 70% of Apple TV viewers of the 2025 MLS Cup were under 45 MLS, and its regular season averaged 3.7 million gross live viewers a week MLS. Digital streams of the three NFL Thanksgiving 2025 games, across platforms, averaged 2.2 million, small against the games' 44.7 million average audience but up 58% NFL.
Fights and wrestling travel well on streaming. Netflix estimates Jake Paul vs. Mike Tyson in November 2024 averaged 108 million live viewers globally Netflix and peaked at 65 million concurrent streams Netflix; the co-main event, Katie Taylor vs. Amanda Serrano, averaged 74 millionNetflix. Canelo Álvarez vs. Terence Crawford in September 2025 averaged an estimated 41.4 million on a Live+1 basis Netflix. In WWE's first year on Netflix, members watched 525M hours of WWE Netflix, Raw drew nearly 340M views Netflix and averaged more than 3M views a week Netflix. WWE posts on Netflix's own social channels added 5.8B impressions Netflix. Netflix's Japan-only stream of the 2026 World Baseball Classic delivered 31.4 million viewers, its most-watched program ever in Japan Netflix.
How much sports video do people watch on YouTube and TikTok?
A lot, and YouTube's own number keeps rising. YouTube said in February 2025 that more than 35 billion hours of sports content are watched on it each year YouTube; in October 2025 Google put it at 40 billion hours, from May 2025 data Google Ads blog; and in July 2026 YouTube said 45 billionYouTube. YouTube publishes these as hours. It does not publish sports' share of all YouTube views or a category rank (see the claims section below).
The NFL is the biggest single case. Videos related to the NFL drew more than 20 billion views on YouTube in 2025 YouTube Culture & Trends, more than 30% of them in the offseason. Annual views of NFL-related content grew more than 250% from 2020 to 2025, and uploads of NFL-related videos grew more than 400%YouTube Culture & Trends. Uploads grew faster than views; YouTube calls the upload growth fan-driven.
Big tournaments spike it further. During the 2026 World Cup, YouTube counted more than 1.7 billion unique viewers of World Cup videos YouTube; official broadcasts of the final drew 21 million average viewers across 40 markets YouTube; and FIFA's own channel gained 4 billion views YouTube. On TikTok, World Cup content drew 1.2 trillion views TikTok and @fifaworldcup alone 28 billionTikTok, against FIFA's 4 billion YouTube views over the same window. More than 22 million videos were shared with World Cup hashtags TikTok. Paris 2024 Olympics content on YouTube had more than 850M unique viewers YouTube and more than 650M hours watched YouTube.
Creators are part of this. YouTube says World Cup videos from its creator roster drew more than 2.5 billion views during the 2026 tournament YouTube, and TikTok says more than 60 million sports creators post on it TikTok. Sports podcasts drew more than 8.5 billion views on YouTube in 2025 Google. In a Google and SmithGeiger survey, 56% of U.S. Gen Z sports fans aged 14 to 24 said they watch athletes' podcasts or videos every week Google. The Super Bowl LX flag football game drew 14 million live views on YouTube YouTube, and the ten most popular halftime shows on YouTube have more than 1.5 billion views YouTube.
Two survey figures come from the platforms' own commissioned research and should be read that way: YouTube says surveyed users are 1.7x more likely to associate sports clips with Shorts than with other short-video apps YouTube, and in a TikTok-commissioned Ipsos study, 85% of fans said they use TikTok as a second screen during live events TikTok, with no sample size published. TikTok also says the NFL and its 32 clubs drew more than 5 billion views on TikTok in the 2023 season TikTok.
How many views do the leagues' own social videos get?
Billions per season, by their own counts. The NBA reports a record 228 billion social media views in the 2025-26 regular season, up 13%, measured by Videocites NBA. Its most-viewed player was LeBron James with 2.85 billion views NBA, and NBA App watch hours per user rose 20%NBA. MLB reports more than 17.8 billion social views in its 2025 regular season, up 20% MLB, and a record 19.39 billion minutes watched on MLB.TV MLB. MLS league and club accounts passed 13.7 billion impressions MLS, and TNT Sports' social accounts posted 1.79 billion views of NHL content in 2025-26 TNT Sports.
The leagues measure these in different ways: views, impressions, minutes and watch hours are different units, so the totals cannot be ranked against each other. Clubs and brands also report follower counts in filings. TKO says that at the end of 2025 WWE had more than 110 million YouTube subscribers TKO 10-K and UFC about 350 million social followers TKO 10-K. Manchester United's YouTube channel had more than 11.2 million subscribers in June 2026 Manchester United 20-F, against 33.2 million TikTok followers and 65.7 million on Instagram Manchester United 20-F. Liverpool FC reports 11.9 billion social views in 2023-24 Liverpool FC.
Who pays for sports video, and how much?
Broadcasters and streamers, by billions a year, and media rights are the biggest revenue line for many sports owners. All figures in this section are company-reported in SEC filings or shareholder letters. TKO Group (UFC, WWE and IMG) took 2,605,116 thousand dollars, about $2.6 billion, from media rights, production and content in 2025 TKO 10-K, out of total revenue of 4,735.2 million TKO 10-K. UFC's media rights were 907.7 million of its revenue and WWE's 1,000.6 million TKO 10-K. WWE's media rights rose 135.1 million in 2025, which TKO attributes to Netflix's Raw deal TKO 10-K, a contract with an initial 10-year term TKO 10-K. From 2026, Paramount is the U.S. home of UFC: 13 numbered events and 30 Fight Nights a year TKO 10-K, which helped UFC's media rights revenue rise 64.7 million in the second quarter of 2026 TKO 10-Q.
Formula 1's total motorsport revenue was 3,873 million dollars in 2025 Liberty Media 10-K, and media rights rose on fee increases, F1 TV subscriptions and the F1 movie Liberty Media. Manchester United's broadcasting revenue rose 19.6% on a third-place Premier League finish Manchester United 20-F, and the club cites the Premier League's 2025/26 to 2028/29 UK deal at £6.7 billion 20-F. Its in-house channel MUTV brought in £5.7 million 20-F. The Braves' broadcasting revenue rose 22.5 million dollars in 2025 on extra streaming rights Braves 10-K.
What sports are worth to TV networks and streamers
Disney's domestic ESPN business had revenue of 16,085 million dollars in fiscal 2025, up 5%, and operating income of 2,801 million, down 8% Disney 10-K. ESPN's advertising revenue was 4,273 million Disney 10-K, and ESPN reached an estimated 61 million pay-TV subscribers in September 2025 by Nielsen's count Disney 10-K. ESPN launched its direct-to-consumer plans in August 2025Disney 10-K, and Disney no longer discloses ESPN+ subscribers. In the nine months to June 27, 2026, Disney's Sports programming and production costs were 10,539 million Disney 10-Q; its Sports segment earned 858 million in that fiscal third quarter, down $179 million as higher programming and production costs outweighed growth in subscription and affiliate fees, on revenue of 4,500 million Disney 10-Q.
Fox's fiscal 2025 advertising revenue rose $1.4 billion, of which about 870 million came from sports led by Super Bowl LIX Fox 10-K; its costs rose by about $1 billion from sports rights and production Fox 10-K. Without a Super Bowl the next year, its TV advertising still rose 318 million on the World Cup and extra postseason games Fox 10-K. NBCUniversal booked 2,842 million dollars from the Olympics, Super Bowl and World Cup in the first nine months of 2026 Comcast 10-Q. Peacock had 48 million paid subscribers in the third quarter of 2026 Comcast and added 2 million in the second quarter, driven by the NBA playoffs, the World Cup and Love Island USA Comcast. Losing the NBA cost Warner Bros. Discovery 414 million dollars of advertising revenue in the second quarter of 2026 alone WBD 10-Q.
Regional sports TV is shrinking. Fees paid to the Knicks and Rangers for local media rights fell to 139,237 thousand dollars in fiscal 2026 from $162.9 million MSG Knickerbockers 10-K, while the Knicks had 34 national broadcasts in 2025-26 against 25 the season before 10-K. In the New York area, MSG Networks reached about 2.9 million viewing subscribers in November 2025 Sphere Entertainment 10-K, after a roughly 13% fall in subscribers in 2025 10-K. The Braves ended their regional TV deal in January 2026 and launched a team-owned channel Braves 10-K. Fubo, now combined with Hulu + Live TV, had 5.75 million paid subscribers in the U.S. and Canada in June 2026 Fubo 10-Q.
Streamers keep buying. Amazon reports Thursday Night Football averaged 15 million-plus viewers in 2025 Amazon, and its first NBA Cup final averaged 3 million-plus Amazon. Netflix says it is on track for about $3 billion of ad revenue in 2026, citing live events, a forecast Netflix. Ofcom puts streamers' global spending on sports rights at 13.2bn dollars in 2025, up from $11.3bn Ofcom Media Nations 2026.
How big is the U.S. spectator sports industry?
About $56 billion in receipts. The 2022 Economic Census counted 56,259,277 thousand dollars of receipts, about $56.3 billion, at U.S. spectator sports employers (NAICS 7112), of which sports teams and clubs took 44,029,584 thousand U.S. Census Bureau, Economic Census. That was up from 46,201,163 thousand in 2017 Census. Racetracks took in 7,975,422 thousand and other spectator sports, such as independent athletes, owners of racing cars and horses, and sports trainers, 4,254,271 thousand Census. The Economic Census counted 4,225 employer establishments Census.
Newer figures show growth. Taxable spectator sports firms earned an estimated 31,139 million dollars in the first half of 2026, up 7.0% on the first half of 2025 Census Quarterly Services Survey, after a fourth quarter of 2025 at 19,889 million, the highest in the release's table Census QSS. BLS estimates the industry's real output at 63.4 billion dollars in 2025 (chained 2017 dollars) and projects $80.0 billion by 2035 BLS Employment Projections.
The two employer counts differ because Census and BLS count different things: County Business Patterns counts establishments with payroll in a March pay period, while BLS's QCEW counts every private establishment covered by unemployment insurance, averaged over the year. Racetracks had 525 establishments in 2023 and other spectator sports 3,124CBP. In 2019 there were 4,293 spectator sports establishments with 138,466 employees CBP, and QCEW counted 147,557 employees BLS QCEW.
Most of the industry by business count is one-person operations. Census counted 269,053 nonemployer businesses in 2024, up from 225,447 in 2019 Census, with 6,375,700 thousand dollars of receipts Census. These are self-employed athletes, sports trainers, owners of racing entries and similar, counted separately from employers.
Who works in sports, and what does it pay?
Coaches far outnumber athletes. In May 2025, U.S. employers counted 248,950 jobs for coaches and scouts and 15,070 for athletes and sports competitors BLS OEWS. The median athlete earned $66,710BLS OEWS, but the mean was $206,180BLS OEWS because a few stars earn very large salaries. Coaches and scouts had a median of $47,320BLS OEWS and umpires and referees, 15,780 jobs at a median of $40,710BLS OEWS. Across all 170,410 jobs in spectator sports BLS OEWS, the median wage was $46,700, below the national median for all jobs BLS OEWS.
Few of the people who make sports video work for spectator sports employers. Only 270 film and video editors worked in spectator sports in May 2025, about 1% of the national total, alongside 1,010 camera operators and 850 broadcast technicians. Most sports video is cut at broadcasters, agencies, production companies and by freelancers: BLS counts 35.5% of film and video editors as self-employed BLS Employment Projections. Athletes employed in spectator sports averaged $222,730BLS OEWS, and 29.0% of athletes are self-employed BLS EP. BLS projects coaches and scouts to have about 36,400 openings a year BLS EP, and spectator sports jobs to grow 5.1% from 2025 to 2035 BLS EP.
Time use puts the industry in context. Americans 15 and older spent an average of 0.34 hours a day playing sports, exercising or doing recreation in 2025, and 23.4% did so on an average day BLS American Time Use Survey. They watched 2.61 hours of television a day BLS ATUS; BLS does not publish time spent watching sports separately.
How many people play sports in the U.S.?
A record 8,266,244 participants took part in U.S. high school sports in 2024-25, up 203,942 on the year NFHS participation survey. NFHS counts roster spots, so a student on two teams counts twice. Boys accounted for 4,726,648 and girls 3,539,596, both records NFHS. Participation grew by more than 645,000 in the three years after the first post-pandemic survey and passed the 2018-19 level of 7,937,491NFHS survey. In 1971-72 only 294,015 girls played high school sports NFHS.
In 2024-25, eleven-player football was still the most-played boys' sport, with 1,029,588 players; for girls it is outdoor track and field, with 513,808NFHS. The fastest growth is in girls' flag football, 68,847 players and up 60 percent in a year NFHS, and girls' wrestling, 74,064NFHS. 30,440 students took part in esports NFHS. Texas had the most participants of any state that year, 879,403NFHS.
Federal surveys count students rather than roster spots. In the 2025 Youth Risk Behavior Survey, 57.6% of U.S. high school students had played on at least one sports team in the past year CDC, 60.5% of boys and 54.6% of girls CDC, up from 51.9% in 2023 CDC, MMWR. The National Survey of Children's Health found 56.7% of youth aged 6 to 17 played a team sport or took lessons in 2023-2024, almost 28 million children HRSA. It falls to 50.8% at ages 15 to 17 HRSA and rises with income, to 74.1% in families at four times the poverty line or more, against 36.7% below it HRSA. By state, youth participation ranges from 46.3% in Nevada to 70.9% in New Hampshire HRSA. Aspen Institute's analysis of the same survey has Vermont at 72% of youth aged 6 to 17 in 2023 Aspen Institute Project Play.
A record 554,298 students competed in NCAA championship sports in 2024-25, on a record 19,928 teams NCAA. Division III had the most, 210,878, ahead of Division I at 202,353 and Division II at 141,067NCAA. Women's championship and emerging sports had 242,341 athletes, up 14% in a decade NCAA. Few go further. By NCAA Research's 2024-25 estimates, 8.1% of high school football players play NCAA football NCAA Research, 3.6% of high school boys' basketball players play at an NCAA school NCAA Research, and 1.4% of draft-eligible NCAA football players are drafted into the NFL NCAA Research.
Among adults and children together, SFIA's survey counts a record 92.3 million Americans aged 6 and older who played a team sport in 2025, up 7.6% SFIA, and 250 million who did at least one sport, fitness or leisure activity SFIA. SFIA is an industry association whose members sell sports equipment, and its figures come from 18,000 online interviews. Only 32% of Americans met the federal guideline of 150 minutes of moderate activity a week, by SFIA's measure SFIA, and 158.8 million took part in an activity often enough to count as core participants SFIA. Asked why they play team sports, 58.4% said for fun SFIA. The number of youth team-sport coaches fell from 8.4 million in 2022 to 6.9 million in 2025 SFIA, and girls' team-sport participation drops 17.6 percentage points between ages 16 and 18 SFIA. Pickleball had 24.3 million players in 2025, up from 4.2 million in 2020 SFIA, of whom 7.5 million played eight or more times SFIA. USA Hockey registered 586,002 players in 2025-26 USA Hockey.
Youth sports cost families real money. The average family spent $1,016 on a child's main sport in 2024, up 46% since 2019, and nearly $1,500 on all of that child's sports Aspen Institute Project Play, survey of 1,848 parents. Aspen estimates parents spend more than $40 billion a year on children's sports Aspen and 3 hours, 23 minutes on each practice or game day Aspen.
How many people play golf?
A record 48.1 million Americans aged 6 and older played golf in 2025, on a course or off it, per the National Golf Foundation. 29.1 million played on a course NGF and another 19 million played only off-course, at ranges, simulators or venues such as Topgolf NGF. NGF puts golf's total reach, counting people who watched, read or listened, at 136 millionNGF. NGF is the golf industry's research body and does not publish its sample size or field dates on these pages.
The game is getting younger. Just under 4 million juniors played on a course in 2025, the most since 2004 NGF, and 6.3 million adults aged 18 to 34 did NGF. There were 3.3 million beginners NGF, women were 28% of on-course golfers NGF, and more than 500 million rounds have been played in each of the past six years NGF. Another 21.2 million non-golfers said they were very interested in playing NGF.
In high school, 247,742 students played golf in 2024-25 NFHS, making it the eighth most-played boys' sport at 162,357NFHS. About 5.4% of high school boys' golfers and 6.9% of girls' golfers go on to play NCAA golf NCAA Research. Outside the U.S. and Mexico, The R&A counted 112.2 million golfers The R&A, 47.1 million of them juniors The R&A and 68.3 million playing off-course in 2025 The R&A.
What the popular sports video numbers really say
Sports-marketing agencies, club-content software blogs and statistics roundups repeat a small set of figures about sports video. We traced each one to the organization that first published it. For each we ran exact-phrase searches of the figure and its older wordings ("8 in 10", "four in five", "2.5 times", "twice"), checked Internet Archive captures of the vendors' pages where the archive was reachable, read trade press of the period and followed every "according to" back to its source. Most began as a narrower measurement than the one now quoted.
"Sports highlights are X% of YouTube views"
No one who can measure it publishes that figure. YouTube reports sports as hours watched, not as a share of views or a category rank: more than 40 billion hours a year, in its October 2025 version Google. A 2026 statistics roundup says 58% of U.S. sports fans watch highlights on YouTube monthly "in a 2024 survey" Gitnux; the article it links returns 404 and we found no survey with that number. The "80% lift in sports highlights" headline is YouTube's own February 2018 statement that watch time of highlight videos grew 80 percent from 2016 to 2017, a growth rate, not a share MarTech. Ad-tech vendor Pixability said in January 2022 that YouTube's sports category had passed 1T views, calling it "one of the largest", with no rank. Use instead: survey figures that say what they measured. In a Morning Consult survey of 2,202 U.S. adults in May 2023, 42% of sports fans had watched livestreams or replays of games on YouTube in the past month, against 28% on Facebook Morning Consult. Ring Digital's August 2020 survey of 1,400 highlight viewers found 53% used YouTube regularly for highlights Ring Digital, via Sports Video Group. In a Google/NRG survey of 496 people aged 14 to 44 in April 2026, 65% of sports fans said they go to YouTube before and after live games Google.
"Fans watch 70% of games on mobile"
We found no source that measures 70% of games watched on phones. The 70% now in sports roundups is a streaming figure: a 2025 Parks Associates and InterDigital survey found 70% of U.S. sports viewers in internet households use a streaming service to watch sports The Current, reporting Parks Associates. Google's own mobile figure is lower: in a Google/Ipsos survey of 1,520 U.S. sports fans aged 18 to 54 in December 2017, 30% said they stream live sports on a phone or tablet Think with Google, archived. The mix-up may also borrow YouTube's old "70% of watch time is on mobile", a different claim about all of YouTube that our thumbnail and CTR research traces. Use instead: Ring Digital's Spring 2026 survey, in which 22% of U.S. viewers named a phone or tablet as one of their top two devices for watching TV Ring Digital, and Nielsen's measured streaming audiences in the streaming section above.
"Short-form highlights drive 3x more engagement"
The 3x has no source we could find. What circulates in sports content is "fans consider short-form videos 2.5 times more engaging than long-form" Greenfly, presented as a sports-fan finding without a source. It comes from Sprout Social's 2022 Index, a survey of 1,236 U.S. consumers aged 18 to 75 who use social media, fielded February 22 to March 1, 2022: consumers find short-form video 2.5x more engaging Sprout Social. The ratio is the share who named short-form the most engaging format, 66%, over the share who named long-form Sprout Social, a stated preference rather than measured engagement, and not about sports. Our short-form video statistics trace the same figure. Use instead: production data that says what it counts. On WSC Sports' platform, vertical formats were 63% of more than 8 million videos rights holders made in the first half of 2025 WSC Sports, and average video length fell 13%, to just over a minute WSC Sports. That measures what teams produce, not what fans prefer.
"80% of fans use a second screen"
It began as a measured Google figure from 2017 and lost its scope as it was repeated. In the same Google/Ipsos survey of 1,520 U.S. fans aged 18 to 54, 80% said they use a computer or smartphone while watching live sports on TV Think with Google, archived; trade press reported it in February 2018 as 80 percent of sports viewers MarTech. The unsourced "estimated over 80 percent" wording appears in a September 2019 sports-data company article Data Sports Group, the earliest copy we found; the Internet Archive was down during our check, so an earlier copy may exist. A February 2025 Indian trade-press summary of a FIFS-Deloitte report repeats the same "80 percent are estimated" phrasing MediaNews4U, and sports-marketing blogs repeat it as 80%Zappi or 80% "studies suggest" PT Sport Suite. Use instead, with its own label: a 2026 Bango survey found 39% of Americans use a second screen while watching live sport, and 58% of those aged 18 to 24 and of those aged 25 to 34 Bango. Bango sells subscription-bundling technology to telcos and streamers and publishes no sample size or field dates; its base is all Americans, not only fans, which explains part of the gap.
"Gen Z watch highlights instead of live games"
The headline figure does not match its own source. Bango's June 2026 release is headlined "51% of Gen Z say highlights are replacing live games" Bango, and Sports Video Group repeated the headline at 51%Sports Video Group. The release body gives 51% to Americans aged 25 to 34 and 47% to those 18 to 24, against 38% of all adults Bango. Other surveys point the other way. In WSC Sports' October 2025 survey of 1,050 U.S. fans, 74.7% of Gen Z respondents (aged 18 to 29) named full live games among the two kinds of content they watch most WSC Sports, while 39% rated short highlights equal to or above live viewing WSC Sports. Morning Consult found in December 2020 that 38% of Gen Z fans watched highlights at least weekly, less than the 43% of all fans Morning Consult. Its September 2020 poll, in which only 1 in 4 Americans aged 13 to 23 watched live sports weekly Morning Consult, is the likely root of the idea. Variety's 2021 finding that 58% of MLB fans prefer highlights covers ages 18 to 34, not Gen Z InsideHook, reporting Variety. Use instead: the age the survey actually measured, with its field date.
"Sports are X of the 100 most-watched broadcasts"
The answer depends on which list is counted. Nielsen does not publish a top-100 count on its own site, so every version is trade press ranking Nielsen data. For 2025, one count put sports at 96 of the 100 most-watched U.S. programs, projected before the year ended Barrett Media, and Sportico's final list counts 95Sportico. On Variety's primetime-only list, sports were 75 of 100 in 2024 Awful Announcing, reporting Variety and 56/100 in 2023 Awful Announcing, the same year all-day lists put sports at 96. Use instead: say whose list, which year, and whether it counts all day or primetime only.
"Video gets 1200% more shares"
Sports content repeats it only lightly; a video agency's page for sporting-goods makers says video can raise social reach "by up to 1200%" Beverly Boy Productions. The measurement underneath is a 2012 count of posts on Facebook's ten biggest brand pages, where videos were shared 12 times more than links and text posts combined Adweek. It says nothing about sports and is fourteen years old. Our fact-check page collects this trace and the others above.
We started from the questions people search for about sports video statistics and looked for the organization that actually produced each answer. Every figure on this page sits in an evidence ledger with its source, the exact table or paragraph it came from, the measurement period, the population measured, and the date we checked it. This edition holds 359 figures from 56 publishers.
On October 31, 2026, each of the sourced figures on this page was re-fetched with the fetch cache cleared and matched against the recorded wording: Census counts through the Census data API and County Business Patterns tables, BLS jobs and wages through the BLS data API and QCEW open data, company figures from SEC filings and shareholder letters on EDGAR, audience figures from Nielsen's own press releases and the leagues', networks' and platforms' own pages, and pages that refuse scripts (bls.gov, cdc.gov, mchb.hrsa.gov, ofcom.org.uk, older Think with Google pages) through dated Internet Archive captures. Our own figures come from a YouTube Data API read of the official channels of 149 NFL, NBA, MLB, NHL and MLS teams on October 31, 2026, covering uploads from May 4 to October 30, 2026; the per-channel and per-video data is published in channels.csv and videos.csv. We left out Nielsen's download-gated Tops of Sports reports, Variety's paywalled survey report (cited only as reported elsewhere), and NFHS's softball count, where the release and the survey table disagree.
We only cite the producer: government agencies, regulators, company filings and official posts, and the survey owner's own report. We do not cite statistics roundups, Statista-style aggregators, or salary sites without a public method. We did not bypass paywalls or sign-up forms; where a full report was gated, we used only the figures its publisher states publicly.
Figures marked "our calculation" are arithmetic on the cited numbers, and anyone can reproduce them:
median across 144 team channels of each channel's median views per Short (median_views_per_short); regular: median across 149 channels of median_views_per_regular
median across 148 team channels of median_regular_likes_per_1000_views (likes/views*1000 per regular video at least 7 days old, then median per channel); Shorts: same over 143 channels
This edition contains no Mark Studios customer data.
Limitations
Our team-channel read covers 180 days, not a full year. A full year did not fit the YouTube API quota. The window from May 4 to October 30, 2026 catches each league at a different point in its season, five teams (the Falcons, Rockets, Bucks, Pacers and Mavericks) are missing because neither Wikidata nor their official sites linked a channel, and view counts are a snapshot that favours older uploads.
Audience figures are not all measured the same way. Nielsen's average audience, Nielsen's reach, Netflix's global average minute audience, Amazon's unique viewers, and the leagues' social views and impressions are different units. Nielsen moved the Super Bowl and the NBA Finals to its Big Data + Panel method in 2026, so part of those rises reflects the method. The page keeps the units apart and labels each one.
Many figures come from parties with a stake. Netflix, Amazon, YouTube, TikTok, Fox and NBCUniversal report on their own platforms and broadcasts; the leagues and clubs report on their own channels; SFIA's members sell sports equipment; WSC Sports, Greenfly, Bango and Ring Digital sell into sports media. Company filings are company-reported. Each is labelled where it appears.
Census and BLS count different things. County Business Patterns counts establishments with payroll in March; QCEW averages every covered private establishment over the year; nonemployer businesses are self-employed people counted separately; OEWS job counts exclude the self-employed, while Employment Projections include them. Neither agency publishes time spent watching sports.
Participation counts measure different people. NFHS counts high school roster spots, so a student on two teams counts twice; CDC and HRSA count students and children; SFIA and the National Golf Foundation run their own surveys and do not publish full methods on the pages we cite.
Several figures are snapshots. Follower and subscriber counts, YouTube's yearly sports watch-time claim and the leagues' season totals change; each carries its date.
How to cite this page
For a single figure, cite the original publisher named next to it, and link here if the verification trail is useful to your readers. Each figure has its own anchor, so you can link straight to it, for example https://www.markstudios.com/research/sports-video-statistics#DRV-003. To cite the page as a whole:
Mark Studios. "Sports Video Statistics." Last verified Oct 31, 2026. https://www.markstudios.com/research/sports-video-statistics
APA
Mark Studios. (2026, October 31). Sports video statistics. https://www.markstudios.com/research/sports-video-statistics
MLA
“Sports Video Statistics.” Mark Studios, 31 Oct. 2026, www.markstudios.com/research/sports-video-statistics.
Chicago
Mark Studios. “Sports Video Statistics.” Last modified October 31, 2026. https://www.markstudios.com/research/sports-video-statistics.
BibTeX
@misc{markstudios_sports_video_statistics_2026,
  author = {{Mark Studios}},
  title = {{Sports Video Statistics}},
  year = {2026},
  month = oct,
  url = {https://www.markstudios.com/research/sports-video-statistics},
  note = {Last verified 2026-10-31}
}
Our calculations and the evidence table are free to reuse with attribution and a link to this page. Each underlying figure remains the claim of its original publisher, and some publishers ask for a link when their figures are reused.
We re-verify every figure quarterly and when a major source publishes a new edition. The next scheduled review is January 2027. Corrections go to contact@markstudios.com.
Oct 31, 2026: First published with 359 figures from 56 publishers, each checked against its original source.
Oct 31, 2026: Corrected several descriptions after a source-by-source check. TKO's $2.6 billion from media rights, production and content includes IMG as well as UFC and WWE. Pew found fewer than four in ten adults follow sports even somewhat closely, not about a third. Disney's Sports segment costs outgrew its fee growth, not its revenue. The NFL's 2.2 million Thanksgiving figure is digital streaming across all platforms. Netflix's 41.4 million for Canelo-Crawford is an average audience, not reach. The 1.4% drafted is of draft-eligible NCAA football players. The Parks Associates survey does not say which screens sports viewers stream on. Also tightened smaller wording, including the NAICS description of other spectator sports.
Frequently asked questions
How many Shorts do NFL and NBA teams post on YouTube?
In our read of 149 team channels from May 4 to October 30, 2026, Shorts were 59.5% of the median NFL team's uploads and 63.9% of the median NBA team's. The median NFL team posted 24.3 videos a week.
How many people watched the Super Bowl in 2026?
An estimated 125.6 million U.S. viewers watched Super Bowl LX on February 8, 2026, per Nielsen, the second-largest audience on record after Super Bowl LIX's 127.7 million in 2025. Viewing peaked at 137.8 million.
How much sports content is watched on YouTube?
More than 45 billion hours a year, YouTube said in July 2026. YouTube reports sports in hours watched; it does not publish sports' share of all YouTube views or a category rank.
What is the most-streamed NFL game?
Amazon says its January 2026 Wild Card game on Prime Video reached 31.6 million viewers. Before that, Netflix's Lions-Vikings game on Christmas Day 2025 held the record at 27.5 million U.S. viewers per Nielsen.
What is the most popular sport to watch in the U.S.?
Football, but its lead is shrinking. In Gallup's August 2026 poll, 31% of U.S. adults named football their favorite sport to watch, down from 41% in 2023, and 20% named no favorite.
How big is the spectator sports industry?
U.S. spectator sports employers took in about $56.3 billion in 2022, per the Economic Census, and employed an annual average of 170,798 people in 2025, per BLS.
How many people play golf in the U.S.?
A record 48.1 million Americans aged 6 and older played golf in 2025, of whom 29.1 million played on a course, per the National Golf Foundation.
Do 80% of sports fans use a second screen?
That comes from a 2017 Google/Ipsos survey of U.S. fans aged 18 to 54, 80% of whom used a computer or phone while watching live sports on TV. A 2026 Bango survey of all Americans found 39%.